Paiute vs Immigrants from Bulgaria Ambulatory Disability
COMPARE
Paiute
Immigrants from Bulgaria
Ambulatory Disability
Ambulatory Disability Comparison
Paiute
Immigrants from Bulgaria
7.7%
AMBULATORY DISABILITY
0.0/ 100
METRIC RATING
330th/ 347
METRIC RANK
5.6%
AMBULATORY DISABILITY
99.8/ 100
METRIC RATING
55th/ 347
METRIC RANK
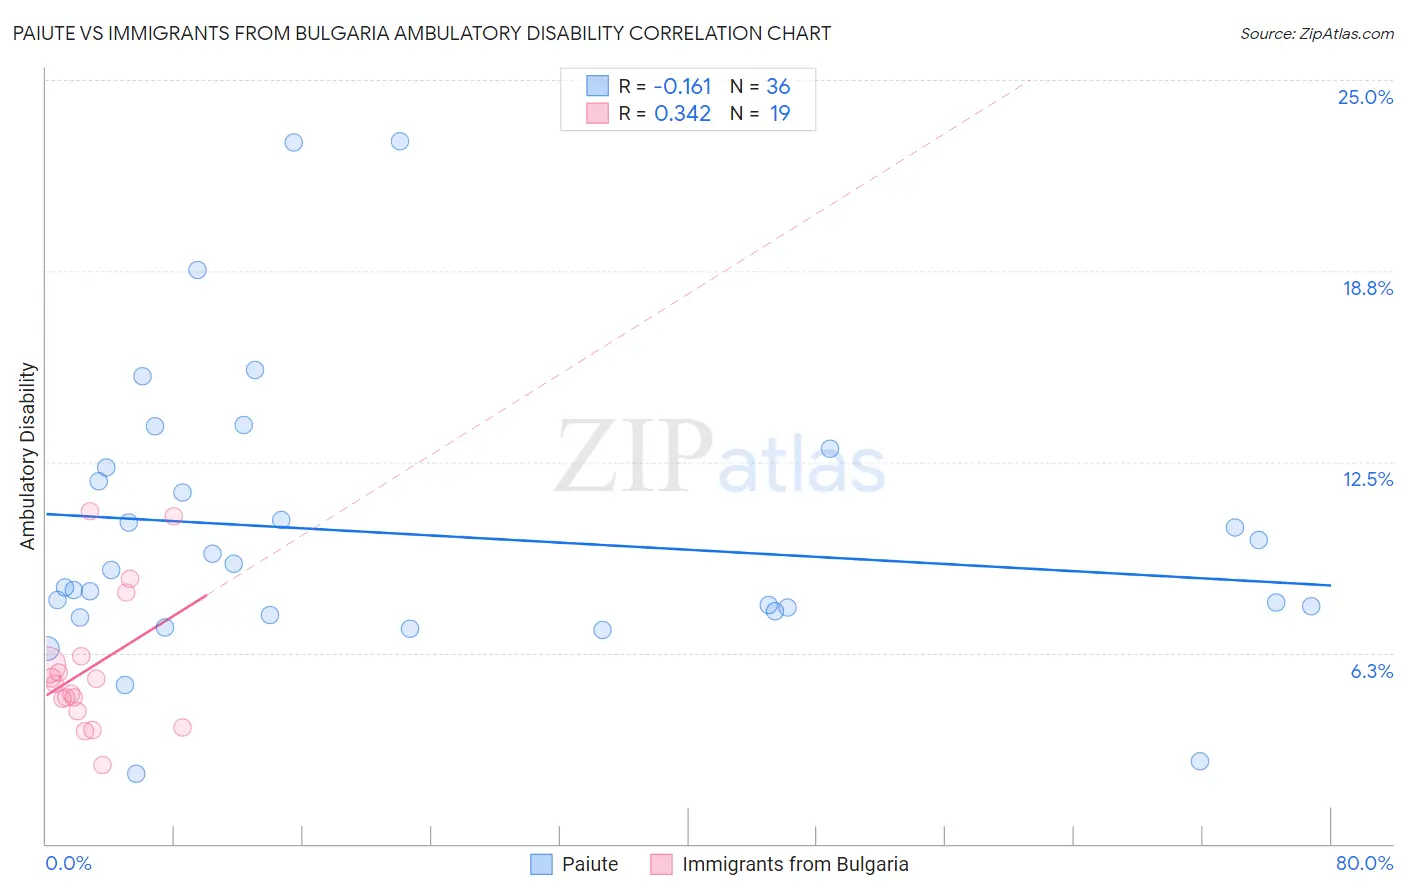
Paiute vs Immigrants from Bulgaria Ambulatory Disability Correlation Chart
The statistical analysis conducted on geographies consisting of 58,391,383 people shows a poor negative correlation between the proportion of Paiute and percentage of population with ambulatory disability in the United States with a correlation coefficient (R) of -0.161 and weighted average of 7.7%. Similarly, the statistical analysis conducted on geographies consisting of 172,546,961 people shows a mild positive correlation between the proportion of Immigrants from Bulgaria and percentage of population with ambulatory disability in the United States with a correlation coefficient (R) of 0.342 and weighted average of 5.6%, a difference of 37.2%.
Ambulatory Disability Correlation Summary
| Measurement | Paiute | Immigrants from Bulgaria |
| Minimum | 2.3% | 2.6% |
| Maximum | 23.0% | 10.9% |
| Range | 20.7% | 8.3% |
| Mean | 10.1% | 5.8% |
| Median | 8.7% | 5.2% |
| Interquartile 25% (IQ1) | 7.5% | 4.3% |
| Interquartile 75% (IQ3) | 12.1% | 6.1% |
| Interquartile Range (IQR) | 4.5% | 1.8% |
| Standard Deviation (Sample) | 4.6% | 2.3% |
| Standard Deviation (Population) | 4.6% | 2.2% |
Similar Demographics by Ambulatory Disability
Demographics Similar to Paiute by Ambulatory Disability
In terms of ambulatory disability, the demographic groups most similar to Paiute are Cajun (7.8%, a difference of 1.2%), Pueblo (7.6%, a difference of 1.3%), Hopi (7.6%, a difference of 1.3%), Menominee (7.8%, a difference of 1.5%), and Native/Alaskan (7.5%, a difference of 2.2%).
| Demographics | Rating | Rank | Ambulatory Disability |
| Americans | 0.0 /100 | #323 | Tragic 7.4% |
| Navajo | 0.0 /100 | #324 | Tragic 7.5% |
| Comanche | 0.0 /100 | #325 | Tragic 7.5% |
| Blacks/African Americans | 0.0 /100 | #326 | Tragic 7.5% |
| Natives/Alaskans | 0.0 /100 | #327 | Tragic 7.5% |
| Hopi | 0.0 /100 | #328 | Tragic 7.6% |
| Pueblo | 0.0 /100 | #329 | Tragic 7.6% |
| Paiute | 0.0 /100 | #330 | Tragic 7.7% |
| Cajuns | 0.0 /100 | #331 | Tragic 7.8% |
| Menominee | 0.0 /100 | #332 | Tragic 7.8% |
| Cherokee | 0.0 /100 | #333 | Tragic 7.9% |
| Yuman | 0.0 /100 | #334 | Tragic 7.9% |
| Chickasaw | 0.0 /100 | #335 | Tragic 8.0% |
| Seminole | 0.0 /100 | #336 | Tragic 8.0% |
| Dutch West Indians | 0.0 /100 | #337 | Tragic 8.2% |
Demographics Similar to Immigrants from Bulgaria by Ambulatory Disability
In terms of ambulatory disability, the demographic groups most similar to Immigrants from Bulgaria are Immigrants from Eastern Africa (5.6%, a difference of 0.070%), Inupiat (5.6%, a difference of 0.090%), Immigrants from Egypt (5.6%, a difference of 0.11%), Jordanian (5.6%, a difference of 0.12%), and Taiwanese (5.6%, a difference of 0.21%).
| Demographics | Rating | Rank | Ambulatory Disability |
| Immigrants | Argentina | 99.9 /100 | #48 | Exceptional 5.6% |
| Bulgarians | 99.9 /100 | #49 | Exceptional 5.6% |
| Luxembourgers | 99.9 /100 | #50 | Exceptional 5.6% |
| Taiwanese | 99.8 /100 | #51 | Exceptional 5.6% |
| Jordanians | 99.8 /100 | #52 | Exceptional 5.6% |
| Immigrants | Egypt | 99.8 /100 | #53 | Exceptional 5.6% |
| Immigrants | Eastern Africa | 99.8 /100 | #54 | Exceptional 5.6% |
| Immigrants | Bulgaria | 99.8 /100 | #55 | Exceptional 5.6% |
| Inupiat | 99.8 /100 | #56 | Exceptional 5.6% |
| Immigrants | Brazil | 99.8 /100 | #57 | Exceptional 5.6% |
| Immigrants | Zimbabwe | 99.8 /100 | #58 | Exceptional 5.6% |
| Immigrants | Afghanistan | 99.8 /100 | #59 | Exceptional 5.6% |
| Immigrants | Lithuania | 99.8 /100 | #60 | Exceptional 5.6% |
| Immigrants | Belgium | 99.7 /100 | #61 | Exceptional 5.6% |
| Immigrants | Spain | 99.7 /100 | #62 | Exceptional 5.6% |