Immigrants from Guyana vs New Zealander Ambulatory Disability
COMPARE
Immigrants from Guyana
New Zealander
Ambulatory Disability
Ambulatory Disability Comparison
Immigrants from Guyana
New Zealanders
6.7%
AMBULATORY DISABILITY
0.1/ 100
METRIC RATING
275th/ 347
METRIC RANK
5.8%
AMBULATORY DISABILITY
97.6/ 100
METRIC RATING
104th/ 347
METRIC RANK
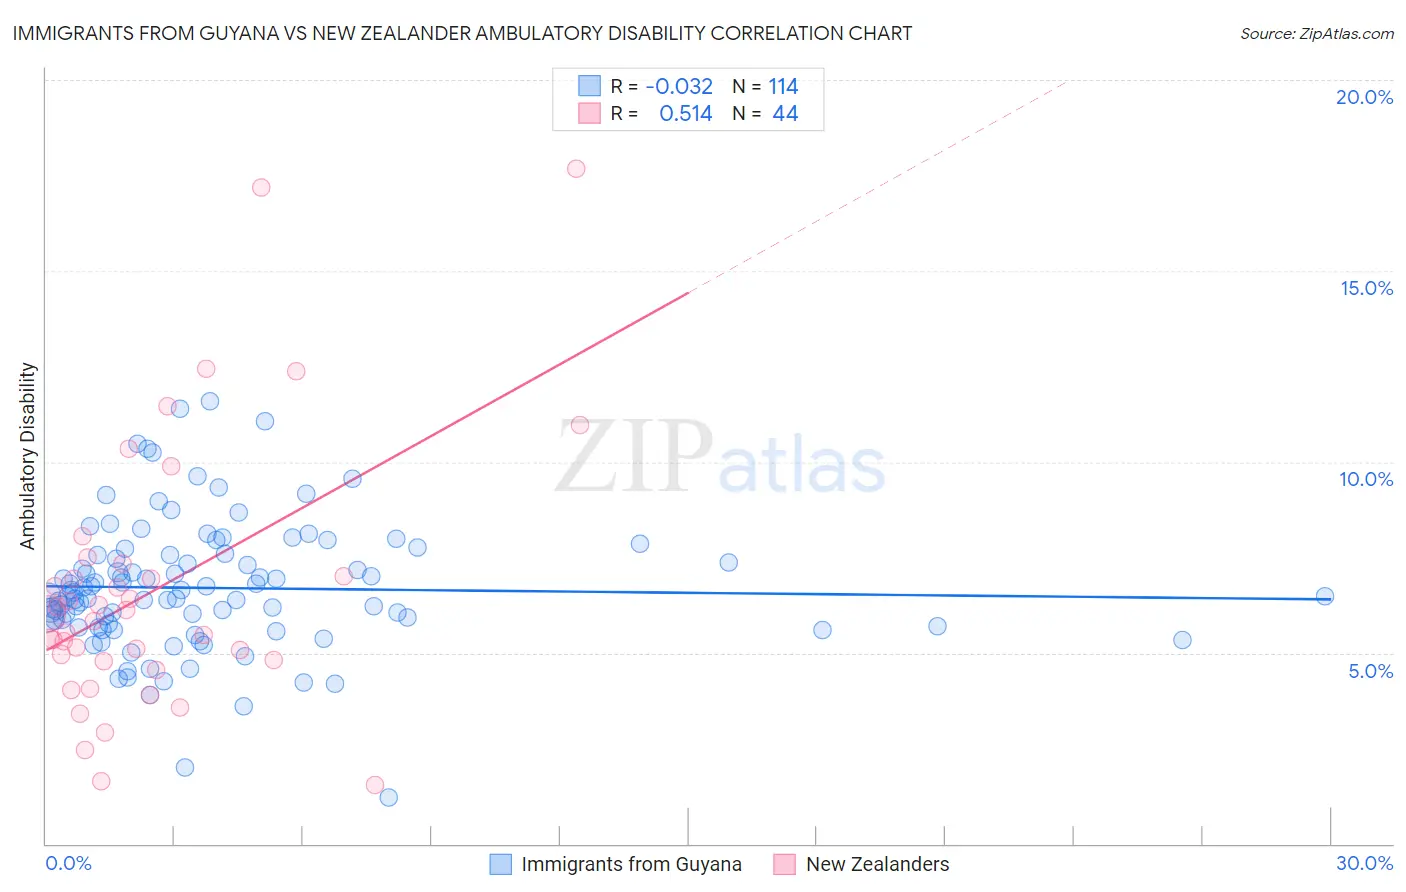
Immigrants from Guyana vs New Zealander Ambulatory Disability Correlation Chart
The statistical analysis conducted on geographies consisting of 183,703,785 people shows no correlation between the proportion of Immigrants from Guyana and percentage of population with ambulatory disability in the United States with a correlation coefficient (R) of -0.032 and weighted average of 6.7%. Similarly, the statistical analysis conducted on geographies consisting of 106,904,660 people shows a substantial positive correlation between the proportion of New Zealanders and percentage of population with ambulatory disability in the United States with a correlation coefficient (R) of 0.514 and weighted average of 5.8%, a difference of 15.4%.
Ambulatory Disability Correlation Summary
| Measurement | Immigrants from Guyana | New Zealander |
| Minimum | 1.2% | 1.5% |
| Maximum | 11.6% | 17.7% |
| Range | 10.4% | 16.2% |
| Mean | 6.7% | 6.6% |
| Median | 6.5% | 5.9% |
| Interquartile 25% (IQ1) | 5.7% | 4.8% |
| Interquartile 75% (IQ3) | 7.6% | 7.2% |
| Interquartile Range (IQR) | 1.9% | 2.4% |
| Standard Deviation (Sample) | 1.7% | 3.5% |
| Standard Deviation (Population) | 1.7% | 3.4% |
Similar Demographics by Ambulatory Disability
Demographics Similar to Immigrants from Guyana by Ambulatory Disability
In terms of ambulatory disability, the demographic groups most similar to Immigrants from Guyana are Celtic (6.7%, a difference of 0.030%), Sioux (6.7%, a difference of 0.060%), Jamaican (6.7%, a difference of 0.11%), Immigrants from West Indies (6.7%, a difference of 0.18%), and White/Caucasian (6.7%, a difference of 0.31%).
| Demographics | Rating | Rank | Ambulatory Disability |
| Spanish | 0.2 /100 | #268 | Tragic 6.6% |
| French | 0.1 /100 | #269 | Tragic 6.6% |
| Slovaks | 0.1 /100 | #270 | Tragic 6.7% |
| Immigrants | Trinidad and Tobago | 0.1 /100 | #271 | Tragic 6.7% |
| French Canadians | 0.1 /100 | #272 | Tragic 6.7% |
| Whites/Caucasians | 0.1 /100 | #273 | Tragic 6.7% |
| Sioux | 0.1 /100 | #274 | Tragic 6.7% |
| Immigrants | Guyana | 0.1 /100 | #275 | Tragic 6.7% |
| Celtics | 0.1 /100 | #276 | Tragic 6.7% |
| Jamaicans | 0.1 /100 | #277 | Tragic 6.7% |
| Immigrants | West Indies | 0.1 /100 | #278 | Tragic 6.7% |
| Immigrants | Caribbean | 0.0 /100 | #279 | Tragic 6.7% |
| Pennsylvania Germans | 0.0 /100 | #280 | Tragic 6.8% |
| Yaqui | 0.0 /100 | #281 | Tragic 6.8% |
| Barbadians | 0.0 /100 | #282 | Tragic 6.8% |
Demographics Similar to New Zealanders by Ambulatory Disability
In terms of ambulatory disability, the demographic groups most similar to New Zealanders are Immigrants from Romania (5.8%, a difference of 0.060%), Immigrants from Czechoslovakia (5.8%, a difference of 0.11%), Immigrants from Kenya (5.8%, a difference of 0.13%), Immigrants from Morocco (5.8%, a difference of 0.18%), and Immigrants from Serbia (5.8%, a difference of 0.21%).
| Demographics | Rating | Rank | Ambulatory Disability |
| Immigrants | Somalia | 98.3 /100 | #97 | Exceptional 5.8% |
| Immigrants | Lebanon | 98.3 /100 | #98 | Exceptional 5.8% |
| Immigrants | Northern Europe | 98.2 /100 | #99 | Exceptional 5.8% |
| Immigrants | Serbia | 97.9 /100 | #100 | Exceptional 5.8% |
| Immigrants | South America | 97.9 /100 | #101 | Exceptional 5.8% |
| Immigrants | Kenya | 97.8 /100 | #102 | Exceptional 5.8% |
| Immigrants | Romania | 97.7 /100 | #103 | Exceptional 5.8% |
| New Zealanders | 97.6 /100 | #104 | Exceptional 5.8% |
| Immigrants | Czechoslovakia | 97.4 /100 | #105 | Exceptional 5.8% |
| Immigrants | Morocco | 97.3 /100 | #106 | Exceptional 5.8% |
| Uruguayans | 97.2 /100 | #107 | Exceptional 5.8% |
| Colombians | 97.2 /100 | #108 | Exceptional 5.8% |
| Immigrants | Netherlands | 97.1 /100 | #109 | Exceptional 5.8% |
| Immigrants | Colombia | 96.7 /100 | #110 | Exceptional 5.8% |
| Danes | 96.6 /100 | #111 | Exceptional 5.8% |