Barbadian vs New Zealander Ambulatory Disability
COMPARE
Barbadian
New Zealander
Ambulatory Disability
Ambulatory Disability Comparison
Barbadians
New Zealanders
6.8%
AMBULATORY DISABILITY
0.0/ 100
METRIC RATING
282nd/ 347
METRIC RANK
5.8%
AMBULATORY DISABILITY
97.6/ 100
METRIC RATING
104th/ 347
METRIC RANK
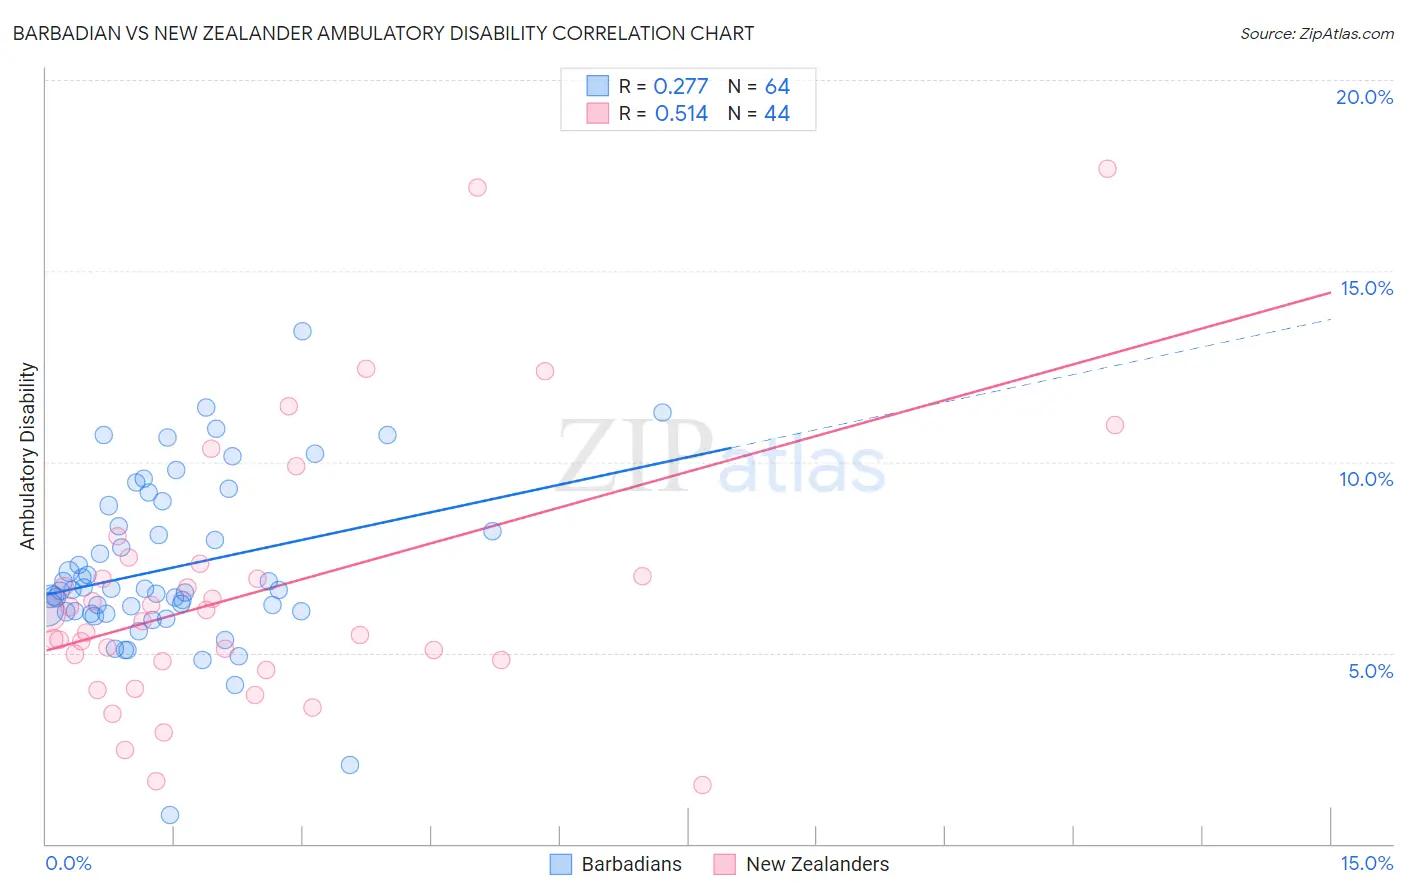
Barbadian vs New Zealander Ambulatory Disability Correlation Chart
The statistical analysis conducted on geographies consisting of 141,286,079 people shows a weak positive correlation between the proportion of Barbadians and percentage of population with ambulatory disability in the United States with a correlation coefficient (R) of 0.277 and weighted average of 6.8%. Similarly, the statistical analysis conducted on geographies consisting of 106,904,660 people shows a substantial positive correlation between the proportion of New Zealanders and percentage of population with ambulatory disability in the United States with a correlation coefficient (R) of 0.514 and weighted average of 5.8%, a difference of 16.3%.
Ambulatory Disability Correlation Summary
| Measurement | Barbadian | New Zealander |
| Minimum | 0.77% | 1.5% |
| Maximum | 13.4% | 17.7% |
| Range | 12.7% | 16.2% |
| Mean | 7.2% | 6.6% |
| Median | 6.7% | 5.9% |
| Interquartile 25% (IQ1) | 6.1% | 4.8% |
| Interquartile 75% (IQ3) | 8.6% | 7.2% |
| Interquartile Range (IQR) | 2.5% | 2.4% |
| Standard Deviation (Sample) | 2.2% | 3.5% |
| Standard Deviation (Population) | 2.2% | 3.4% |
Similar Demographics by Ambulatory Disability
Demographics Similar to Barbadians by Ambulatory Disability
In terms of ambulatory disability, the demographic groups most similar to Barbadians are Yaqui (6.8%, a difference of 0.13%), Immigrants from Barbados (6.8%, a difference of 0.16%), Pennsylvania German (6.8%, a difference of 0.20%), Immigrants from Jamaica (6.8%, a difference of 0.23%), and Immigrants from Caribbean (6.7%, a difference of 0.30%).
| Demographics | Rating | Rank | Ambulatory Disability |
| Immigrants | Guyana | 0.1 /100 | #275 | Tragic 6.7% |
| Celtics | 0.1 /100 | #276 | Tragic 6.7% |
| Jamaicans | 0.1 /100 | #277 | Tragic 6.7% |
| Immigrants | West Indies | 0.1 /100 | #278 | Tragic 6.7% |
| Immigrants | Caribbean | 0.0 /100 | #279 | Tragic 6.7% |
| Pennsylvania Germans | 0.0 /100 | #280 | Tragic 6.8% |
| Yaqui | 0.0 /100 | #281 | Tragic 6.8% |
| Barbadians | 0.0 /100 | #282 | Tragic 6.8% |
| Immigrants | Barbados | 0.0 /100 | #283 | Tragic 6.8% |
| Immigrants | Jamaica | 0.0 /100 | #284 | Tragic 6.8% |
| Fijians | 0.0 /100 | #285 | Tragic 6.8% |
| Yakama | 0.0 /100 | #286 | Tragic 6.8% |
| U.S. Virgin Islanders | 0.0 /100 | #287 | Tragic 6.8% |
| Immigrants | Nonimmigrants | 0.0 /100 | #288 | Tragic 6.9% |
| Immigrants | Dominica | 0.0 /100 | #289 | Tragic 6.9% |
Demographics Similar to New Zealanders by Ambulatory Disability
In terms of ambulatory disability, the demographic groups most similar to New Zealanders are Immigrants from Romania (5.8%, a difference of 0.060%), Immigrants from Czechoslovakia (5.8%, a difference of 0.11%), Immigrants from Kenya (5.8%, a difference of 0.13%), Immigrants from Morocco (5.8%, a difference of 0.18%), and Immigrants from Serbia (5.8%, a difference of 0.21%).
| Demographics | Rating | Rank | Ambulatory Disability |
| Immigrants | Somalia | 98.3 /100 | #97 | Exceptional 5.8% |
| Immigrants | Lebanon | 98.3 /100 | #98 | Exceptional 5.8% |
| Immigrants | Northern Europe | 98.2 /100 | #99 | Exceptional 5.8% |
| Immigrants | Serbia | 97.9 /100 | #100 | Exceptional 5.8% |
| Immigrants | South America | 97.9 /100 | #101 | Exceptional 5.8% |
| Immigrants | Kenya | 97.8 /100 | #102 | Exceptional 5.8% |
| Immigrants | Romania | 97.7 /100 | #103 | Exceptional 5.8% |
| New Zealanders | 97.6 /100 | #104 | Exceptional 5.8% |
| Immigrants | Czechoslovakia | 97.4 /100 | #105 | Exceptional 5.8% |
| Immigrants | Morocco | 97.3 /100 | #106 | Exceptional 5.8% |
| Uruguayans | 97.2 /100 | #107 | Exceptional 5.8% |
| Colombians | 97.2 /100 | #108 | Exceptional 5.8% |
| Immigrants | Netherlands | 97.1 /100 | #109 | Exceptional 5.8% |
| Immigrants | Colombia | 96.7 /100 | #110 | Exceptional 5.8% |
| Danes | 96.6 /100 | #111 | Exceptional 5.8% |