Osage vs Ute Disability Age Under 5
COMPARE
Osage
Ute
Disability Age Under 5
Disability Age Under 5 Comparison
Osage
Ute
1.8%
DISABILITY AGE UNDER 5
0.0/ 100
METRIC RATING
327th/ 347
METRIC RANK
0.86%
DISABILITY AGE UNDER 5
100.0/ 100
METRIC RATING
6th/ 347
METRIC RANK
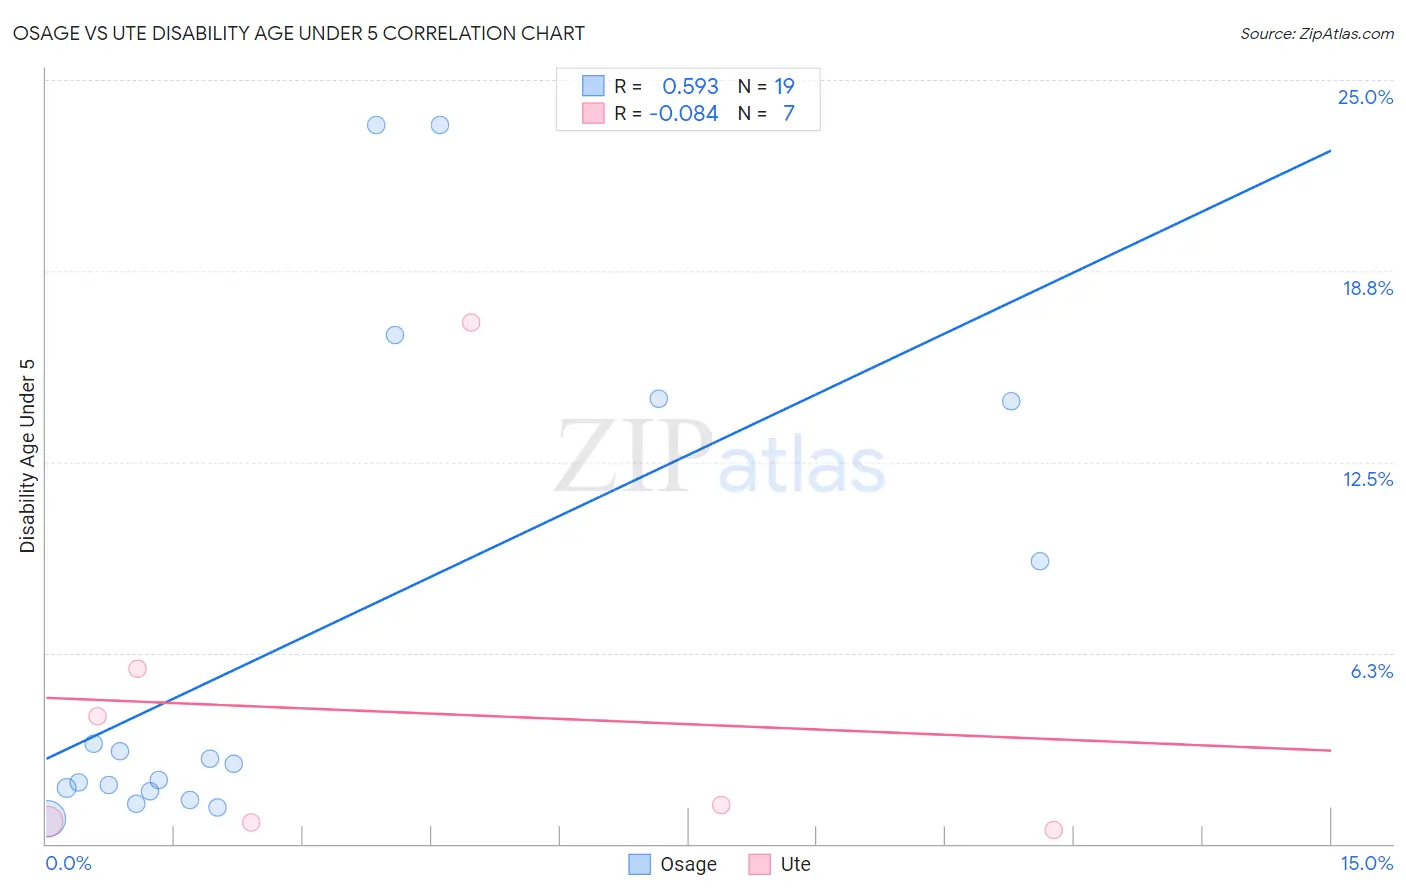
Osage vs Ute Disability Age Under 5 Correlation Chart
The statistical analysis conducted on geographies consisting of 73,230,866 people shows a substantial positive correlation between the proportion of Osage and percentage of population with a disability under the age of 5 in the United States with a correlation coefficient (R) of 0.593 and weighted average of 1.8%. Similarly, the statistical analysis conducted on geographies consisting of 45,228,215 people shows a slight negative correlation between the proportion of Ute and percentage of population with a disability under the age of 5 in the United States with a correlation coefficient (R) of -0.084 and weighted average of 0.86%, a difference of 112.2%.
Disability Age Under 5 Correlation Summary
| Measurement | Osage | Ute |
| Minimum | 0.80% | 0.45% |
| Maximum | 23.5% | 17.1% |
| Range | 22.7% | 16.6% |
| Mean | 6.7% | 4.3% |
| Median | 2.6% | 1.3% |
| Interquartile 25% (IQ1) | 1.7% | 0.70% |
| Interquartile 75% (IQ3) | 14.5% | 5.7% |
| Interquartile Range (IQR) | 12.8% | 5.0% |
| Standard Deviation (Sample) | 7.8% | 6.0% |
| Standard Deviation (Population) | 7.6% | 5.5% |
Similar Demographics by Disability Age Under 5
Demographics Similar to Osage by Disability Age Under 5
In terms of disability age under 5, the demographic groups most similar to Osage are Sioux (1.8%, a difference of 0.39%), American (1.9%, a difference of 1.7%), Immigrants from Portugal (1.8%, a difference of 1.8%), Houma (1.9%, a difference of 2.2%), and Choctaw (1.9%, a difference of 2.5%).
| Demographics | Rating | Rank | Disability Age Under 5 |
| Scotch-Irish | 0.0 /100 | #320 | Tragic 1.7% |
| Ottawa | 0.0 /100 | #321 | Tragic 1.7% |
| Germans | 0.0 /100 | #322 | Tragic 1.7% |
| Chickasaw | 0.0 /100 | #323 | Tragic 1.7% |
| Cherokee | 0.0 /100 | #324 | Tragic 1.8% |
| Immigrants | Portugal | 0.0 /100 | #325 | Tragic 1.8% |
| Sioux | 0.0 /100 | #326 | Tragic 1.8% |
| Osage | 0.0 /100 | #327 | Tragic 1.8% |
| Americans | 0.0 /100 | #328 | Tragic 1.9% |
| Houma | 0.0 /100 | #329 | Tragic 1.9% |
| Choctaw | 0.0 /100 | #330 | Tragic 1.9% |
| French Canadians | 0.0 /100 | #331 | Tragic 1.9% |
| Chippewa | 0.0 /100 | #332 | Tragic 1.9% |
| Dutch West Indians | 0.0 /100 | #333 | Tragic 1.9% |
| Natives/Alaskans | 0.0 /100 | #334 | Tragic 1.9% |
Demographics Similar to Ute by Disability Age Under 5
In terms of disability age under 5, the demographic groups most similar to Ute are Immigrants from Bangladesh (0.85%, a difference of 0.93%), Immigrants from Uzbekistan (0.85%, a difference of 1.3%), Immigrants from Afghanistan (0.91%, a difference of 5.3%), Immigrants from Yemen (0.91%, a difference of 5.4%), and Vietnamese (0.81%, a difference of 6.0%).
| Demographics | Rating | Rank | Disability Age Under 5 |
| Immigrants | Armenia | 100.0 /100 | #1 | Exceptional 0.76% |
| Immigrants | St. Vincent and the Grenadines | 100.0 /100 | #2 | Exceptional 0.79% |
| Vietnamese | 100.0 /100 | #3 | Exceptional 0.81% |
| Immigrants | Uzbekistan | 100.0 /100 | #4 | Exceptional 0.85% |
| Immigrants | Bangladesh | 100.0 /100 | #5 | Exceptional 0.85% |
| Ute | 100.0 /100 | #6 | Exceptional 0.86% |
| Immigrants | Afghanistan | 100.0 /100 | #7 | Exceptional 0.91% |
| Immigrants | Yemen | 100.0 /100 | #8 | Exceptional 0.91% |
| Immigrants | Fiji | 100.0 /100 | #9 | Exceptional 0.92% |
| Marshallese | 100.0 /100 | #10 | Exceptional 0.94% |
| Afghans | 100.0 /100 | #11 | Exceptional 0.94% |
| Immigrants | Grenada | 100.0 /100 | #12 | Exceptional 0.94% |
| Soviet Union | 100.0 /100 | #13 | Exceptional 0.95% |
| Yuman | 100.0 /100 | #14 | Exceptional 0.95% |
| Immigrants | Hong Kong | 100.0 /100 | #15 | Exceptional 0.95% |