Osage vs Egyptian Disability Age Under 5
COMPARE
Osage
Egyptian
Disability Age Under 5
Disability Age Under 5 Comparison
Osage
Egyptians
1.8%
DISABILITY AGE UNDER 5
0.0/ 100
METRIC RATING
327th/ 347
METRIC RANK
1.1%
DISABILITY AGE UNDER 5
98.9/ 100
METRIC RATING
64th/ 347
METRIC RANK
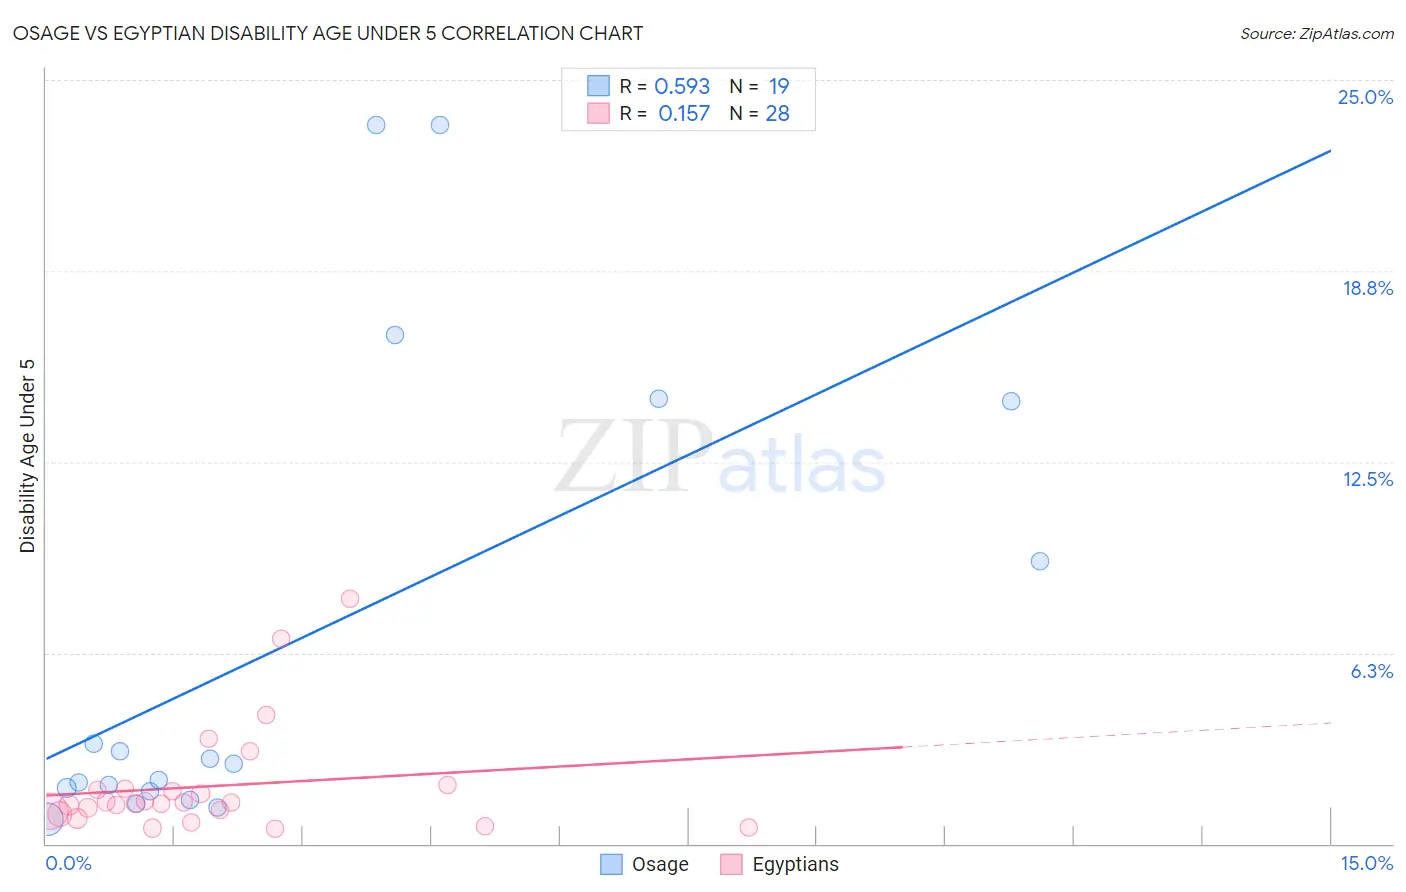
Osage vs Egyptian Disability Age Under 5 Correlation Chart
The statistical analysis conducted on geographies consisting of 73,230,866 people shows a substantial positive correlation between the proportion of Osage and percentage of population with a disability under the age of 5 in the United States with a correlation coefficient (R) of 0.593 and weighted average of 1.8%. Similarly, the statistical analysis conducted on geographies consisting of 167,621,034 people shows a poor positive correlation between the proportion of Egyptians and percentage of population with a disability under the age of 5 in the United States with a correlation coefficient (R) of 0.157 and weighted average of 1.1%, a difference of 64.2%.
Disability Age Under 5 Correlation Summary
| Measurement | Osage | Egyptian |
| Minimum | 0.80% | 0.49% |
| Maximum | 23.5% | 8.0% |
| Range | 22.7% | 7.5% |
| Mean | 6.7% | 1.9% |
| Median | 2.6% | 1.3% |
| Interquartile 25% (IQ1) | 1.7% | 1.0% |
| Interquartile 75% (IQ3) | 14.5% | 1.8% |
| Interquartile Range (IQR) | 12.8% | 0.77% |
| Standard Deviation (Sample) | 7.8% | 1.8% |
| Standard Deviation (Population) | 7.6% | 1.7% |
Similar Demographics by Disability Age Under 5
Demographics Similar to Osage by Disability Age Under 5
In terms of disability age under 5, the demographic groups most similar to Osage are Sioux (1.8%, a difference of 0.39%), American (1.9%, a difference of 1.7%), Immigrants from Portugal (1.8%, a difference of 1.8%), Houma (1.9%, a difference of 2.2%), and Choctaw (1.9%, a difference of 2.5%).
| Demographics | Rating | Rank | Disability Age Under 5 |
| Scotch-Irish | 0.0 /100 | #320 | Tragic 1.7% |
| Ottawa | 0.0 /100 | #321 | Tragic 1.7% |
| Germans | 0.0 /100 | #322 | Tragic 1.7% |
| Chickasaw | 0.0 /100 | #323 | Tragic 1.7% |
| Cherokee | 0.0 /100 | #324 | Tragic 1.8% |
| Immigrants | Portugal | 0.0 /100 | #325 | Tragic 1.8% |
| Sioux | 0.0 /100 | #326 | Tragic 1.8% |
| Osage | 0.0 /100 | #327 | Tragic 1.8% |
| Americans | 0.0 /100 | #328 | Tragic 1.9% |
| Houma | 0.0 /100 | #329 | Tragic 1.9% |
| Choctaw | 0.0 /100 | #330 | Tragic 1.9% |
| French Canadians | 0.0 /100 | #331 | Tragic 1.9% |
| Chippewa | 0.0 /100 | #332 | Tragic 1.9% |
| Dutch West Indians | 0.0 /100 | #333 | Tragic 1.9% |
| Natives/Alaskans | 0.0 /100 | #334 | Tragic 1.9% |
Demographics Similar to Egyptians by Disability Age Under 5
In terms of disability age under 5, the demographic groups most similar to Egyptians are Immigrants from Korea (1.1%, a difference of 0.34%), Immigrants from Vietnam (1.1%, a difference of 0.46%), Immigrants from Indonesia (1.1%, a difference of 0.46%), Immigrants from Belize (1.1%, a difference of 0.53%), and Immigrants from Switzerland (1.1%, a difference of 0.57%).
| Demographics | Rating | Rank | Disability Age Under 5 |
| Assyrians/Chaldeans/Syriacs | 99.5 /100 | #57 | Exceptional 1.1% |
| Immigrants | Egypt | 99.4 /100 | #58 | Exceptional 1.1% |
| Immigrants | Malaysia | 99.4 /100 | #59 | Exceptional 1.1% |
| Immigrants | Western Asia | 99.2 /100 | #60 | Exceptional 1.1% |
| Immigrants | Ethiopia | 99.2 /100 | #61 | Exceptional 1.1% |
| Immigrants | Switzerland | 99.2 /100 | #62 | Exceptional 1.1% |
| Immigrants | Vietnam | 99.1 /100 | #63 | Exceptional 1.1% |
| Egyptians | 98.9 /100 | #64 | Exceptional 1.1% |
| Immigrants | Korea | 98.8 /100 | #65 | Exceptional 1.1% |
| Immigrants | Indonesia | 98.7 /100 | #66 | Exceptional 1.1% |
| Immigrants | Belize | 98.7 /100 | #67 | Exceptional 1.1% |
| South Africans | 98.7 /100 | #68 | Exceptional 1.1% |
| Israelis | 98.7 /100 | #69 | Exceptional 1.1% |
| Immigrants | Ecuador | 98.6 /100 | #70 | Exceptional 1.1% |
| Trinidadians and Tobagonians | 98.6 /100 | #71 | Exceptional 1.1% |