Osage vs Ute 11th Grade
COMPARE
Osage
Ute
11th Grade
11th Grade Comparison
Osage
Ute
92.7%
11TH GRADE
73.4/ 100
METRIC RATING
154th/ 347
METRIC RANK
91.1%
11TH GRADE
0.2/ 100
METRIC RATING
269th/ 347
METRIC RANK
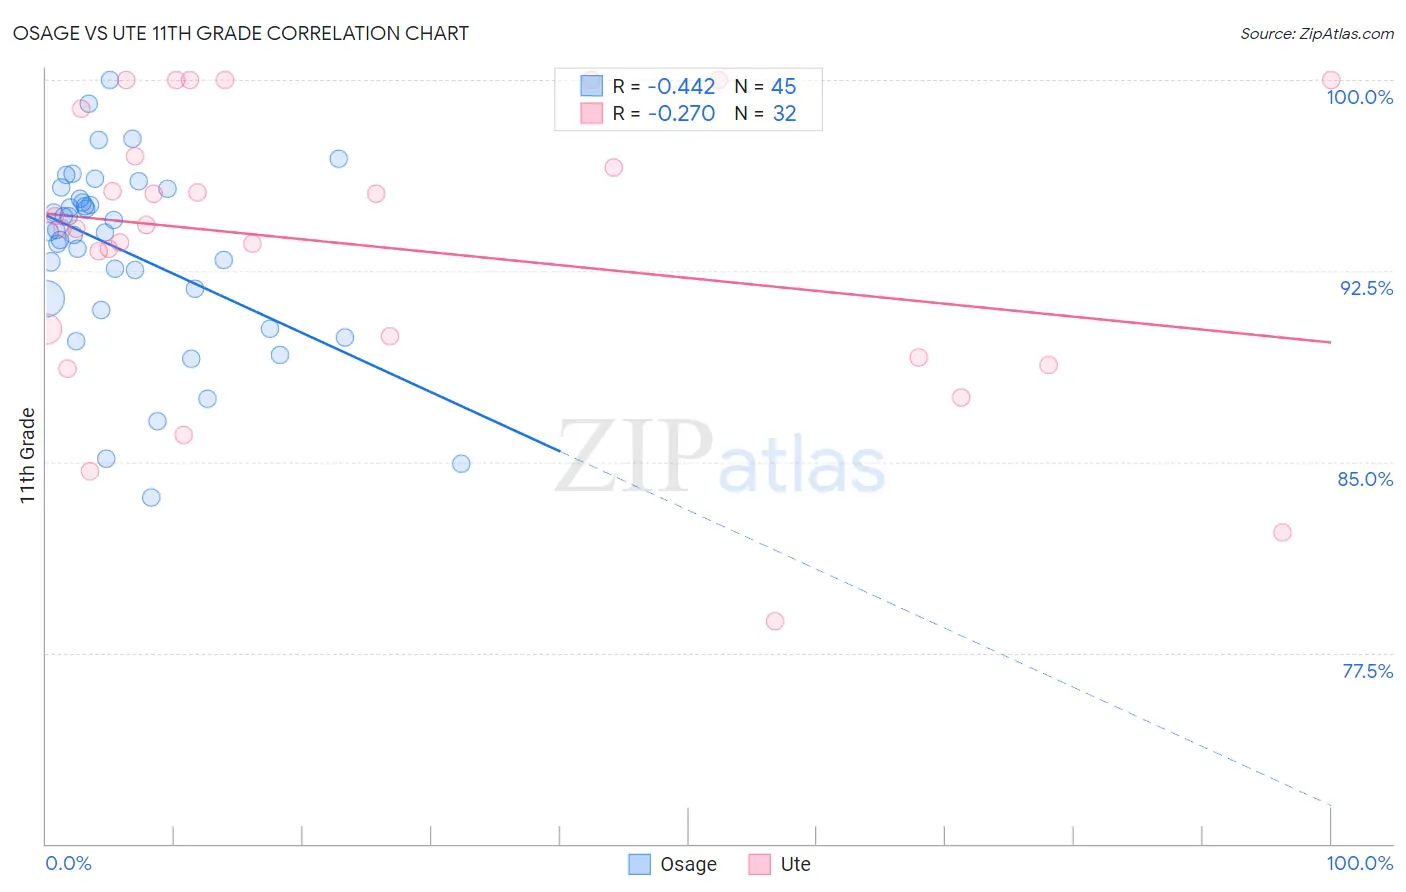
Osage vs Ute 11th Grade Correlation Chart
The statistical analysis conducted on geographies consisting of 91,808,929 people shows a moderate negative correlation between the proportion of Osage and percentage of population with at least 11th grade education in the United States with a correlation coefficient (R) of -0.442 and weighted average of 92.7%. Similarly, the statistical analysis conducted on geographies consisting of 55,668,599 people shows a weak negative correlation between the proportion of Ute and percentage of population with at least 11th grade education in the United States with a correlation coefficient (R) of -0.270 and weighted average of 91.1%, a difference of 1.8%.
11th Grade Correlation Summary
| Measurement | Osage | Ute |
| Minimum | 83.6% | 78.7% |
| Maximum | 100.0% | 100.0% |
| Range | 16.4% | 21.3% |
| Mean | 93.2% | 93.5% |
| Median | 94.1% | 94.2% |
| Interquartile 25% (IQ1) | 91.2% | 89.5% |
| Interquartile 75% (IQ3) | 95.5% | 98.0% |
| Interquartile Range (IQR) | 4.3% | 8.4% |
| Standard Deviation (Sample) | 3.7% | 5.6% |
| Standard Deviation (Population) | 3.6% | 5.5% |
Similar Demographics by 11th Grade
Demographics Similar to Osage by 11th Grade
In terms of 11th grade, the demographic groups most similar to Osage are Argentinean (92.7%, a difference of 0.0%), Immigrants from Spain (92.7%, a difference of 0.0%), Potawatomi (92.8%, a difference of 0.010%), Iraqi (92.8%, a difference of 0.010%), and Brazilian (92.8%, a difference of 0.010%).
| Demographics | Rating | Rank | 11th Grade |
| Immigrants | Kenya | 78.7 /100 | #147 | Good 92.8% |
| Hmong | 78.6 /100 | #148 | Good 92.8% |
| Immigrants | Poland | 78.5 /100 | #149 | Good 92.8% |
| Immigrants | Egypt | 77.5 /100 | #150 | Good 92.8% |
| Potawatomi | 74.3 /100 | #151 | Good 92.8% |
| Iraqis | 74.2 /100 | #152 | Good 92.8% |
| Brazilians | 73.9 /100 | #153 | Good 92.8% |
| Osage | 73.4 /100 | #154 | Good 92.7% |
| Argentineans | 73.4 /100 | #155 | Good 92.7% |
| Immigrants | Spain | 73.0 /100 | #156 | Good 92.7% |
| Immigrants | Eastern Asia | 72.6 /100 | #157 | Good 92.7% |
| Immigrants | Venezuela | 72.0 /100 | #158 | Good 92.7% |
| Americans | 71.7 /100 | #159 | Good 92.7% |
| Immigrants | Lebanon | 70.7 /100 | #160 | Good 92.7% |
| Immigrants | Argentina | 69.8 /100 | #161 | Good 92.7% |
Demographics Similar to Ute by 11th Grade
In terms of 11th grade, the demographic groups most similar to Ute are U.S. Virgin Islander (91.1%, a difference of 0.030%), Trinidadian and Tobagonian (91.1%, a difference of 0.030%), Immigrants from Peru (91.0%, a difference of 0.060%), West Indian (91.0%, a difference of 0.060%), and Immigrants from Jamaica (91.2%, a difference of 0.10%).
| Demographics | Rating | Rank | 11th Grade |
| Immigrants | Uruguay | 0.5 /100 | #262 | Tragic 91.3% |
| Immigrants | Ghana | 0.3 /100 | #263 | Tragic 91.2% |
| Yup'ik | 0.3 /100 | #264 | Tragic 91.2% |
| Pueblo | 0.3 /100 | #265 | Tragic 91.2% |
| Immigrants | Western Africa | 0.3 /100 | #266 | Tragic 91.2% |
| Immigrants | Jamaica | 0.3 /100 | #267 | Tragic 91.2% |
| U.S. Virgin Islanders | 0.2 /100 | #268 | Tragic 91.1% |
| Ute | 0.2 /100 | #269 | Tragic 91.1% |
| Trinidadians and Tobagonians | 0.2 /100 | #270 | Tragic 91.1% |
| Immigrants | Peru | 0.1 /100 | #271 | Tragic 91.0% |
| West Indians | 0.1 /100 | #272 | Tragic 91.0% |
| Paiute | 0.1 /100 | #273 | Tragic 91.0% |
| Immigrants | Trinidad and Tobago | 0.1 /100 | #274 | Tragic 90.9% |
| Immigrants | South Eastern Asia | 0.1 /100 | #275 | Tragic 90.9% |
| Bangladeshis | 0.1 /100 | #276 | Tragic 90.9% |