Osage vs Ute In Labor Force | Age 25-29
COMPARE
Osage
Ute
In Labor Force | Age 25-29
In Labor Force | Age 25-29 Comparison
Osage
Ute
82.3%
IN LABOR FORCE | AGE 25-29
0.0/ 100
METRIC RATING
310th/ 347
METRIC RANK
80.8%
IN LABOR FORCE | AGE 25-29
0.0/ 100
METRIC RATING
327th/ 347
METRIC RANK
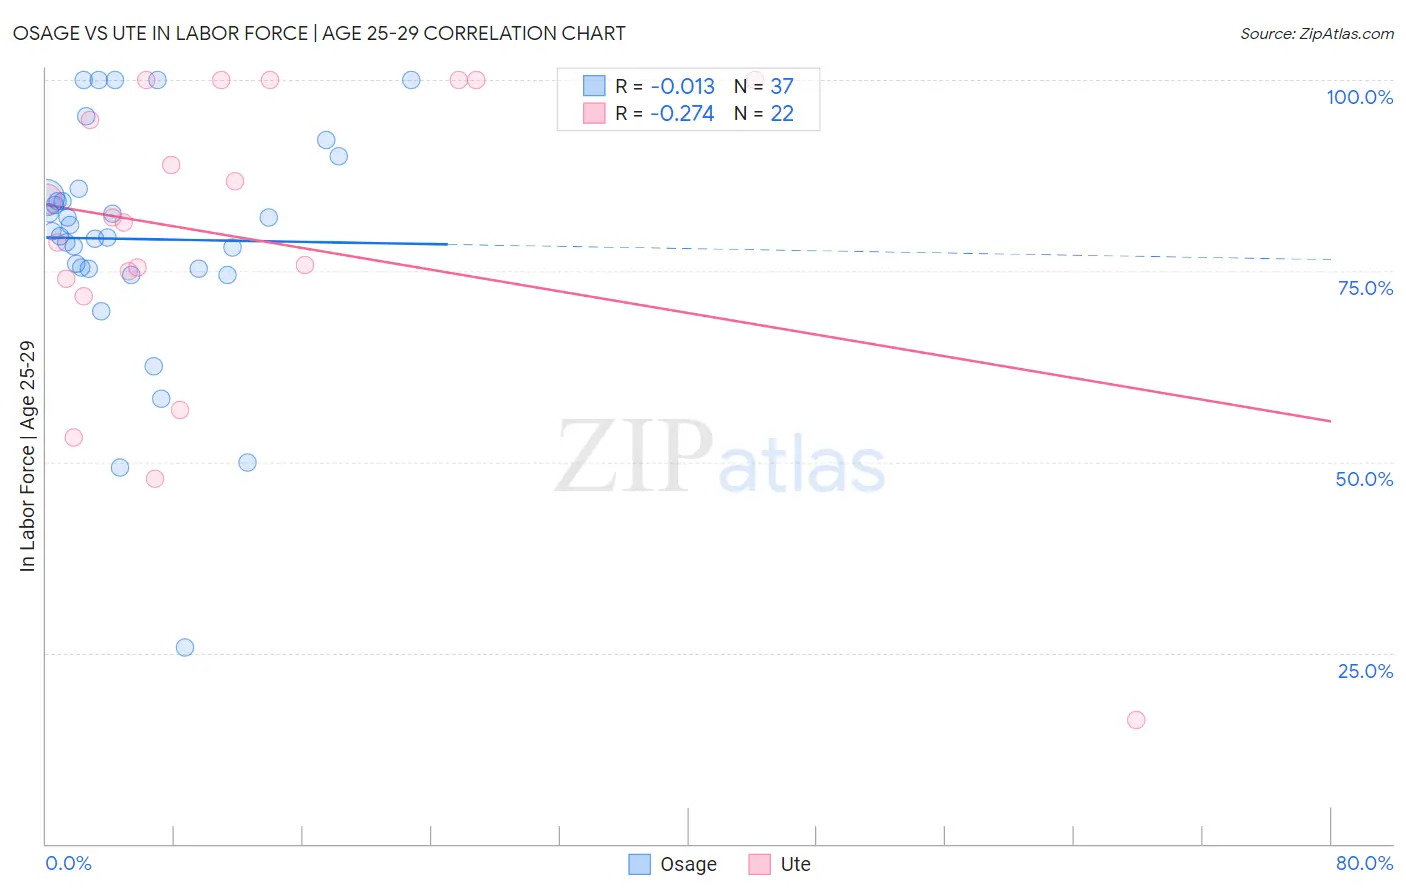
Osage vs Ute In Labor Force | Age 25-29 Correlation Chart
The statistical analysis conducted on geographies consisting of 91,794,280 people shows no correlation between the proportion of Osage and labor force participation rate among population between the ages 25 and 29 in the United States with a correlation coefficient (R) of -0.013 and weighted average of 82.3%. Similarly, the statistical analysis conducted on geographies consisting of 55,662,248 people shows a weak negative correlation between the proportion of Ute and labor force participation rate among population between the ages 25 and 29 in the United States with a correlation coefficient (R) of -0.274 and weighted average of 80.8%, a difference of 1.8%.
In Labor Force | Age 25-29 Correlation Summary
| Measurement | Osage | Ute |
| Minimum | 25.7% | 16.2% |
| Maximum | 100.0% | 100.0% |
| Range | 74.3% | 83.8% |
| Mean | 79.2% | 79.2% |
| Median | 80.2% | 81.7% |
| Interquartile 25% (IQ1) | 75.3% | 73.9% |
| Interquartile 75% (IQ3) | 85.2% | 100.0% |
| Interquartile Range (IQR) | 9.9% | 26.1% |
| Standard Deviation (Sample) | 15.3% | 21.0% |
| Standard Deviation (Population) | 15.1% | 20.5% |
Demographics Similar to Osage and Ute by In Labor Force | Age 25-29
In terms of in labor force | age 25-29, the demographic groups most similar to Osage are Alaskan Athabascan (82.3%, a difference of 0.010%), Hispanic or Latino (82.2%, a difference of 0.080%), Immigrants from Central America (82.4%, a difference of 0.14%), Central American Indian (82.4%, a difference of 0.15%), and Yaqui (82.2%, a difference of 0.17%). Similarly, the demographic groups most similar to Ute are Creek (80.7%, a difference of 0.15%), Choctaw (81.0%, a difference of 0.20%), Dutch West Indian (81.1%, a difference of 0.41%), Houma (81.2%, a difference of 0.52%), and Alaska Native (81.6%, a difference of 0.93%).
| Demographics | Rating | Rank | In Labor Force | Age 25-29 |
| Central American Indians | 0.0 /100 | #308 | Tragic 82.4% |
| Immigrants | Central America | 0.0 /100 | #309 | Tragic 82.4% |
| Osage | 0.0 /100 | #310 | Tragic 82.3% |
| Alaskan Athabascans | 0.0 /100 | #311 | Tragic 82.3% |
| Hispanics or Latinos | 0.0 /100 | #312 | Tragic 82.2% |
| Yaqui | 0.0 /100 | #313 | Tragic 82.2% |
| Cherokee | 0.0 /100 | #314 | Tragic 82.1% |
| Immigrants | Mexico | 0.0 /100 | #315 | Tragic 82.0% |
| Mexicans | 0.0 /100 | #316 | Tragic 81.9% |
| Chickasaw | 0.0 /100 | #317 | Tragic 81.9% |
| Comanche | 0.0 /100 | #318 | Tragic 81.9% |
| Seminole | 0.0 /100 | #319 | Tragic 81.7% |
| Colville | 0.0 /100 | #320 | Tragic 81.6% |
| Shoshone | 0.0 /100 | #321 | Tragic 81.6% |
| Kiowa | 0.0 /100 | #322 | Tragic 81.6% |
| Alaska Natives | 0.0 /100 | #323 | Tragic 81.6% |
| Houma | 0.0 /100 | #324 | Tragic 81.2% |
| Dutch West Indians | 0.0 /100 | #325 | Tragic 81.1% |
| Choctaw | 0.0 /100 | #326 | Tragic 81.0% |
| Ute | 0.0 /100 | #327 | Tragic 80.8% |
| Creek | 0.0 /100 | #328 | Tragic 80.7% |