Osage vs Okinawan Disability Age Under 5
COMPARE
Osage
Okinawan
Disability Age Under 5
Disability Age Under 5 Comparison
Osage
Okinawans
1.8%
DISABILITY AGE UNDER 5
0.0/ 100
METRIC RATING
327th/ 347
METRIC RANK
1.1%
DISABILITY AGE UNDER 5
97.6/ 100
METRIC RATING
86th/ 347
METRIC RANK
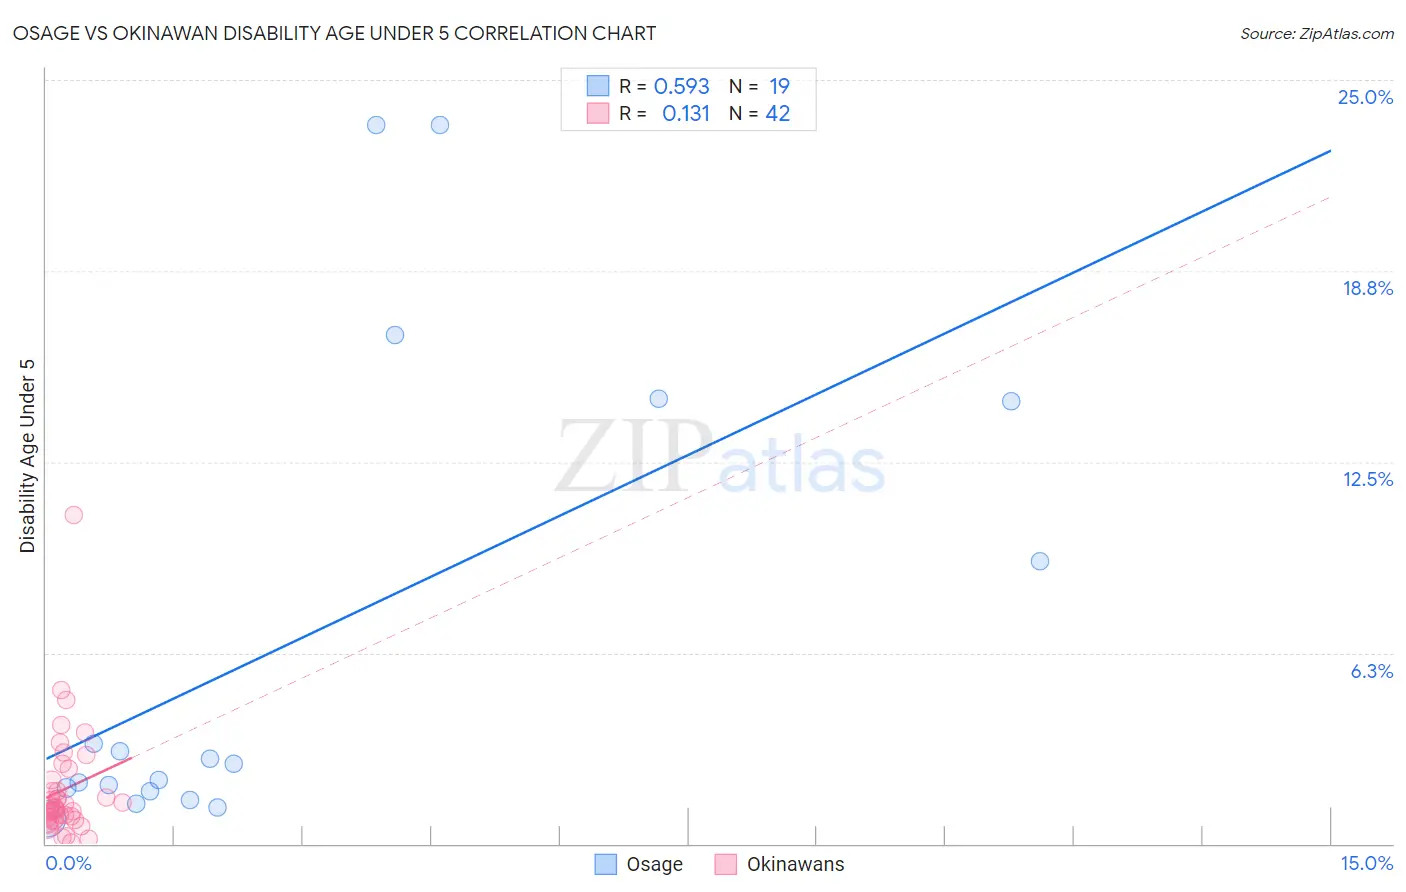
Osage vs Okinawan Disability Age Under 5 Correlation Chart
The statistical analysis conducted on geographies consisting of 73,230,866 people shows a substantial positive correlation between the proportion of Osage and percentage of population with a disability under the age of 5 in the United States with a correlation coefficient (R) of 0.593 and weighted average of 1.8%. Similarly, the statistical analysis conducted on geographies consisting of 59,482,262 people shows a poor positive correlation between the proportion of Okinawans and percentage of population with a disability under the age of 5 in the United States with a correlation coefficient (R) of 0.131 and weighted average of 1.1%, a difference of 60.8%.
Disability Age Under 5 Correlation Summary
| Measurement | Osage | Okinawan |
| Minimum | 0.80% | 0.058% |
| Maximum | 23.5% | 10.8% |
| Range | 22.7% | 10.7% |
| Mean | 6.7% | 1.8% |
| Median | 2.6% | 1.2% |
| Interquartile 25% (IQ1) | 1.7% | 0.80% |
| Interquartile 75% (IQ3) | 14.5% | 2.1% |
| Interquartile Range (IQR) | 12.8% | 1.3% |
| Standard Deviation (Sample) | 7.8% | 1.8% |
| Standard Deviation (Population) | 7.6% | 1.8% |
Similar Demographics by Disability Age Under 5
Demographics Similar to Osage by Disability Age Under 5
In terms of disability age under 5, the demographic groups most similar to Osage are Sioux (1.8%, a difference of 0.39%), American (1.9%, a difference of 1.7%), Immigrants from Portugal (1.8%, a difference of 1.8%), Houma (1.9%, a difference of 2.2%), and Choctaw (1.9%, a difference of 2.5%).
| Demographics | Rating | Rank | Disability Age Under 5 |
| Scotch-Irish | 0.0 /100 | #320 | Tragic 1.7% |
| Ottawa | 0.0 /100 | #321 | Tragic 1.7% |
| Germans | 0.0 /100 | #322 | Tragic 1.7% |
| Chickasaw | 0.0 /100 | #323 | Tragic 1.7% |
| Cherokee | 0.0 /100 | #324 | Tragic 1.8% |
| Immigrants | Portugal | 0.0 /100 | #325 | Tragic 1.8% |
| Sioux | 0.0 /100 | #326 | Tragic 1.8% |
| Osage | 0.0 /100 | #327 | Tragic 1.8% |
| Americans | 0.0 /100 | #328 | Tragic 1.9% |
| Houma | 0.0 /100 | #329 | Tragic 1.9% |
| Choctaw | 0.0 /100 | #330 | Tragic 1.9% |
| French Canadians | 0.0 /100 | #331 | Tragic 1.9% |
| Chippewa | 0.0 /100 | #332 | Tragic 1.9% |
| Dutch West Indians | 0.0 /100 | #333 | Tragic 1.9% |
| Natives/Alaskans | 0.0 /100 | #334 | Tragic 1.9% |
Demographics Similar to Okinawans by Disability Age Under 5
In terms of disability age under 5, the demographic groups most similar to Okinawans are Ugandan (1.1%, a difference of 0.020%), Immigrants from Dominican Republic (1.1%, a difference of 0.040%), Sudanese (1.1%, a difference of 0.13%), Immigrants from Zaire (1.1%, a difference of 0.20%), and Ethiopian (1.1%, a difference of 0.32%).
| Demographics | Rating | Rank | Disability Age Under 5 |
| Hmong | 98.0 /100 | #79 | Exceptional 1.1% |
| Immigrants | Trinidad and Tobago | 98.0 /100 | #80 | Exceptional 1.1% |
| Turks | 98.0 /100 | #81 | Exceptional 1.1% |
| Immigrants | Jordan | 97.9 /100 | #82 | Exceptional 1.1% |
| Immigrants | Syria | 97.9 /100 | #83 | Exceptional 1.1% |
| Immigrants | Zaire | 97.8 /100 | #84 | Exceptional 1.1% |
| Sudanese | 97.7 /100 | #85 | Exceptional 1.1% |
| Okinawans | 97.6 /100 | #86 | Exceptional 1.1% |
| Ugandans | 97.5 /100 | #87 | Exceptional 1.1% |
| Immigrants | Dominican Republic | 97.5 /100 | #88 | Exceptional 1.1% |
| Ethiopians | 97.2 /100 | #89 | Exceptional 1.1% |
| Chinese | 97.2 /100 | #90 | Exceptional 1.1% |
| Albanians | 97.2 /100 | #91 | Exceptional 1.1% |
| Immigrants | Cuba | 97.0 /100 | #92 | Exceptional 1.1% |
| Spanish Americans | 96.9 /100 | #93 | Exceptional 1.1% |