Osage vs Ute Disability Age 18 to 34
COMPARE
Osage
Ute
Disability Age 18 to 34
Disability Age 18 to 34 Comparison
Osage
Ute
8.3%
DISABILITY AGE 18 TO 34
0.0/ 100
METRIC RATING
330th/ 347
METRIC RANK
7.0%
DISABILITY AGE 18 TO 34
3.8/ 100
METRIC RATING
231st/ 347
METRIC RANK
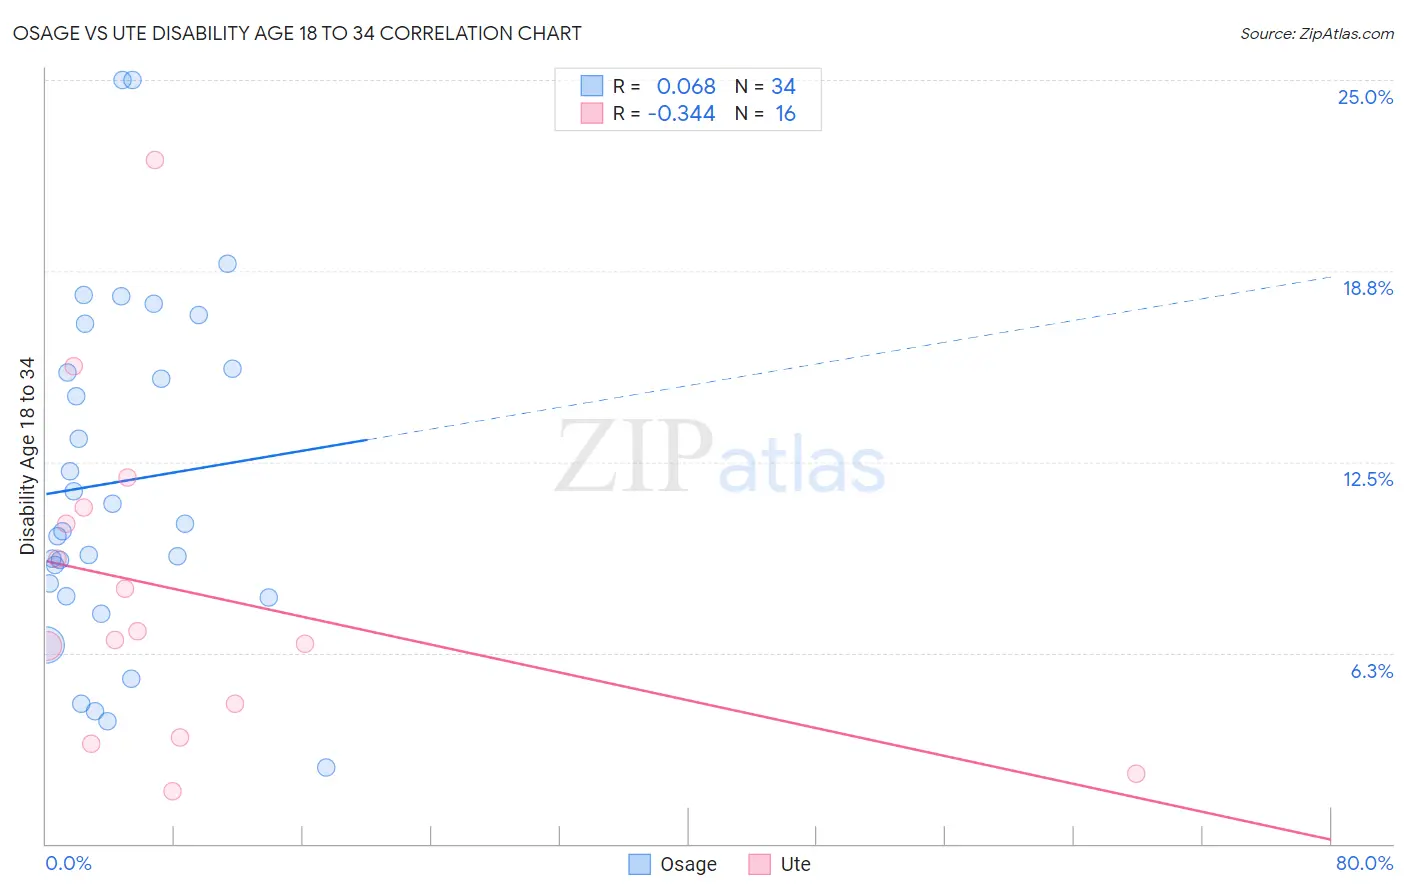
Osage vs Ute Disability Age 18 to 34 Correlation Chart
The statistical analysis conducted on geographies consisting of 91,736,463 people shows a slight positive correlation between the proportion of Osage and percentage of population with a disability between the ages 18 and 35 in the United States with a correlation coefficient (R) of 0.068 and weighted average of 8.3%. Similarly, the statistical analysis conducted on geographies consisting of 55,639,467 people shows a mild negative correlation between the proportion of Ute and percentage of population with a disability between the ages 18 and 35 in the United States with a correlation coefficient (R) of -0.344 and weighted average of 7.0%, a difference of 19.0%.
Disability Age 18 to 34 Correlation Summary
| Measurement | Osage | Ute |
| Minimum | 2.5% | 1.7% |
| Maximum | 25.0% | 22.4% |
| Range | 22.5% | 20.7% |
| Mean | 11.8% | 8.2% |
| Median | 10.4% | 6.8% |
| Interquartile 25% (IQ1) | 8.1% | 4.0% |
| Interquartile 75% (IQ3) | 15.6% | 10.7% |
| Interquartile Range (IQR) | 7.4% | 6.7% |
| Standard Deviation (Sample) | 5.6% | 5.4% |
| Standard Deviation (Population) | 5.5% | 5.2% |
Similar Demographics by Disability Age 18 to 34
Demographics Similar to Osage by Disability Age 18 to 34
In terms of disability age 18 to 34, the demographic groups most similar to Osage are Comanche (8.3%, a difference of 0.18%), Crow (8.3%, a difference of 0.25%), Puget Sound Salish (8.3%, a difference of 0.40%), Delaware (8.2%, a difference of 0.78%), and Sioux (8.2%, a difference of 0.82%).
| Demographics | Rating | Rank | Disability Age 18 to 34 |
| French American Indians | 0.0 /100 | #323 | Tragic 8.2% |
| Cajuns | 0.0 /100 | #324 | Tragic 8.2% |
| Natives/Alaskans | 0.0 /100 | #325 | Tragic 8.2% |
| Potawatomi | 0.0 /100 | #326 | Tragic 8.2% |
| Sioux | 0.0 /100 | #327 | Tragic 8.2% |
| Delaware | 0.0 /100 | #328 | Tragic 8.2% |
| Crow | 0.0 /100 | #329 | Tragic 8.3% |
| Osage | 0.0 /100 | #330 | Tragic 8.3% |
| Comanche | 0.0 /100 | #331 | Tragic 8.3% |
| Puget Sound Salish | 0.0 /100 | #332 | Tragic 8.3% |
| Apache | 0.0 /100 | #333 | Tragic 8.4% |
| Dutch West Indians | 0.0 /100 | #334 | Tragic 8.4% |
| Seminole | 0.0 /100 | #335 | Tragic 8.4% |
| Immigrants | Azores | 0.0 /100 | #336 | Tragic 8.5% |
| Ottawa | 0.0 /100 | #337 | Tragic 8.6% |
Demographics Similar to Ute by Disability Age 18 to 34
In terms of disability age 18 to 34, the demographic groups most similar to Ute are Immigrants from North America (7.0%, a difference of 0.020%), Lithuanian (7.0%, a difference of 0.11%), Immigrants from Yemen (7.0%, a difference of 0.14%), Immigrants from Canada (7.0%, a difference of 0.20%), and Ugandan (6.9%, a difference of 0.25%).
| Demographics | Rating | Rank | Disability Age 18 to 34 |
| Senegalese | 4.9 /100 | #224 | Tragic 6.9% |
| Central American Indians | 4.7 /100 | #225 | Tragic 6.9% |
| Ugandans | 4.4 /100 | #226 | Tragic 6.9% |
| Immigrants | Canada | 4.3 /100 | #227 | Tragic 7.0% |
| Immigrants | Yemen | 4.2 /100 | #228 | Tragic 7.0% |
| Lithuanians | 4.1 /100 | #229 | Tragic 7.0% |
| Immigrants | North America | 3.9 /100 | #230 | Tragic 7.0% |
| Ute | 3.8 /100 | #231 | Tragic 7.0% |
| Samoans | 3.2 /100 | #232 | Tragic 7.0% |
| New Zealanders | 2.7 /100 | #233 | Tragic 7.0% |
| Alsatians | 2.1 /100 | #234 | Tragic 7.0% |
| Sub-Saharan Africans | 1.7 /100 | #235 | Tragic 7.1% |
| Liberians | 1.5 /100 | #236 | Tragic 7.1% |
| Austrians | 1.3 /100 | #237 | Tragic 7.1% |
| Marshallese | 1.3 /100 | #238 | Tragic 7.1% |