Osage vs Immigrants from Iraq Hearing Disability
COMPARE
Osage
Immigrants from Iraq
Hearing Disability
Hearing Disability Comparison
Osage
Immigrants from Iraq
4.1%
HEARING DISABILITY
0.0/ 100
METRIC RATING
324th/ 347
METRIC RANK
3.1%
HEARING DISABILITY
10.5/ 100
METRIC RATING
213th/ 347
METRIC RANK
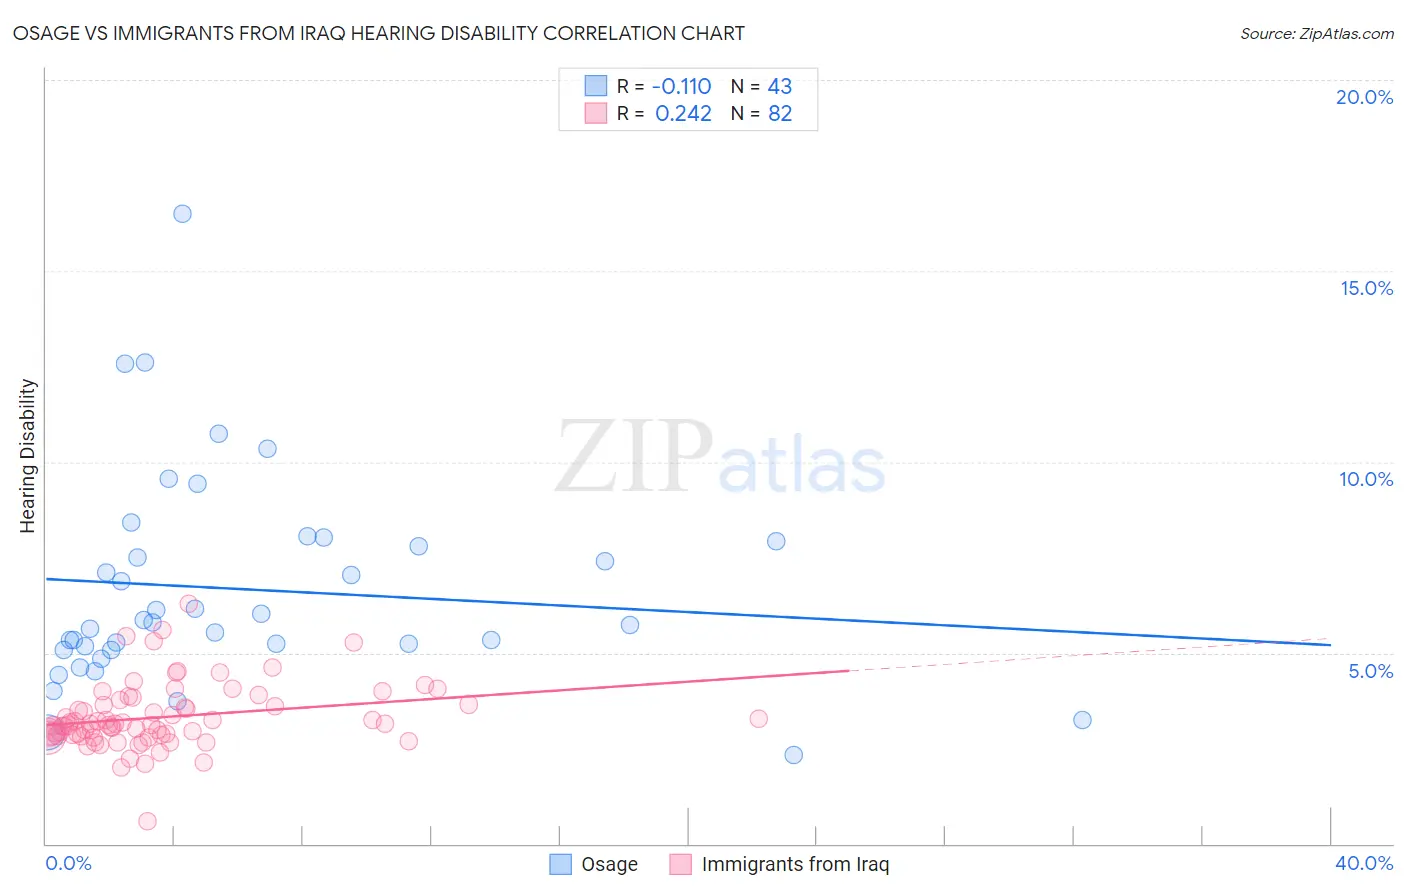
Osage vs Immigrants from Iraq Hearing Disability Correlation Chart
The statistical analysis conducted on geographies consisting of 91,798,863 people shows a poor negative correlation between the proportion of Osage and percentage of population with hearing disability in the United States with a correlation coefficient (R) of -0.110 and weighted average of 4.1%. Similarly, the statistical analysis conducted on geographies consisting of 194,749,544 people shows a weak positive correlation between the proportion of Immigrants from Iraq and percentage of population with hearing disability in the United States with a correlation coefficient (R) of 0.242 and weighted average of 3.1%, a difference of 30.1%.
Hearing Disability Correlation Summary
| Measurement | Osage | Immigrants from Iraq |
| Minimum | 2.3% | 0.59% |
| Maximum | 16.5% | 6.3% |
| Range | 14.2% | 5.7% |
| Mean | 6.7% | 3.3% |
| Median | 5.8% | 3.1% |
| Interquartile 25% (IQ1) | 5.1% | 2.8% |
| Interquartile 75% (IQ3) | 7.9% | 3.6% |
| Interquartile Range (IQR) | 2.8% | 0.81% |
| Standard Deviation (Sample) | 2.8% | 0.86% |
| Standard Deviation (Population) | 2.8% | 0.86% |
Similar Demographics by Hearing Disability
Demographics Similar to Osage by Hearing Disability
In terms of hearing disability, the demographic groups most similar to Osage are Apache (4.1%, a difference of 0.070%), Seminole (4.1%, a difference of 0.19%), Lumbee (4.1%, a difference of 0.32%), Paiute (4.1%, a difference of 0.45%), and Potawatomi (4.1%, a difference of 0.61%).
| Demographics | Rating | Rank | Hearing Disability |
| Comanche | 0.0 /100 | #317 | Tragic 4.0% |
| Cheyenne | 0.0 /100 | #318 | Tragic 4.0% |
| Chippewa | 0.0 /100 | #319 | Tragic 4.0% |
| Shoshone | 0.0 /100 | #320 | Tragic 4.0% |
| Paiute | 0.0 /100 | #321 | Tragic 4.1% |
| Seminole | 0.0 /100 | #322 | Tragic 4.1% |
| Apache | 0.0 /100 | #323 | Tragic 4.1% |
| Osage | 0.0 /100 | #324 | Tragic 4.1% |
| Lumbee | 0.0 /100 | #325 | Tragic 4.1% |
| Potawatomi | 0.0 /100 | #326 | Tragic 4.1% |
| Arapaho | 0.0 /100 | #327 | Tragic 4.1% |
| Tohono O'odham | 0.0 /100 | #328 | Tragic 4.2% |
| Crow | 0.0 /100 | #329 | Tragic 4.2% |
| Natives/Alaskans | 0.0 /100 | #330 | Tragic 4.2% |
| Cherokee | 0.0 /100 | #331 | Tragic 4.2% |
Demographics Similar to Immigrants from Iraq by Hearing Disability
In terms of hearing disability, the demographic groups most similar to Immigrants from Iraq are Pakistani (3.1%, a difference of 0.15%), Romanian (3.1%, a difference of 0.36%), Cape Verdean (3.1%, a difference of 0.39%), Immigrants from Hungary (3.1%, a difference of 0.44%), and Immigrants from Latvia (3.1%, a difference of 0.48%).
| Demographics | Rating | Rank | Hearing Disability |
| Eastern Europeans | 15.5 /100 | #206 | Poor 3.1% |
| Hispanics or Latinos | 15.1 /100 | #207 | Poor 3.1% |
| Immigrants | Latvia | 12.7 /100 | #208 | Poor 3.1% |
| Immigrants | Hungary | 12.5 /100 | #209 | Poor 3.1% |
| Cape Verdeans | 12.2 /100 | #210 | Poor 3.1% |
| Romanians | 12.1 /100 | #211 | Poor 3.1% |
| Pakistanis | 11.1 /100 | #212 | Poor 3.1% |
| Immigrants | Iraq | 10.5 /100 | #213 | Poor 3.1% |
| Australians | 8.1 /100 | #214 | Tragic 3.2% |
| Bangladeshis | 8.1 /100 | #215 | Tragic 3.2% |
| Immigrants | Norway | 7.3 /100 | #216 | Tragic 3.2% |
| Russians | 7.1 /100 | #217 | Tragic 3.2% |
| Immigrants | Northern Europe | 7.0 /100 | #218 | Tragic 3.2% |
| New Zealanders | 6.8 /100 | #219 | Tragic 3.2% |
| Malaysians | 6.6 /100 | #220 | Tragic 3.2% |