Osage vs Kenyan Hearing Disability
COMPARE
Osage
Kenyan
Hearing Disability
Hearing Disability Comparison
Osage
Kenyans
4.1%
HEARING DISABILITY
0.0/ 100
METRIC RATING
324th/ 347
METRIC RANK
2.8%
HEARING DISABILITY
89.8/ 100
METRIC RATING
119th/ 347
METRIC RANK
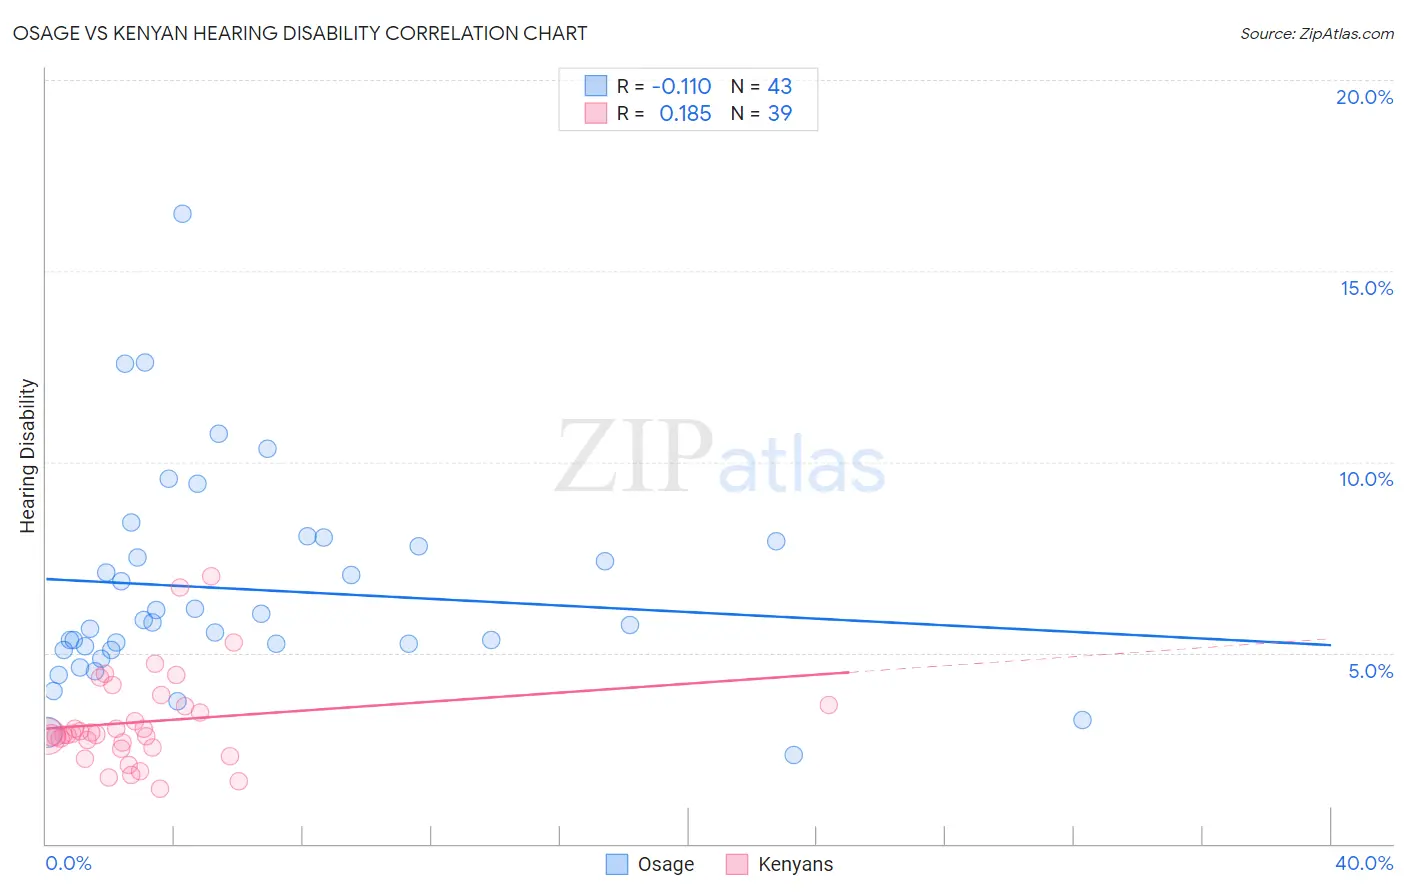
Osage vs Kenyan Hearing Disability Correlation Chart
The statistical analysis conducted on geographies consisting of 91,798,863 people shows a poor negative correlation between the proportion of Osage and percentage of population with hearing disability in the United States with a correlation coefficient (R) of -0.110 and weighted average of 4.1%. Similarly, the statistical analysis conducted on geographies consisting of 168,202,963 people shows a poor positive correlation between the proportion of Kenyans and percentage of population with hearing disability in the United States with a correlation coefficient (R) of 0.185 and weighted average of 2.8%, a difference of 44.1%.
Hearing Disability Correlation Summary
| Measurement | Osage | Kenyan |
| Minimum | 2.3% | 1.5% |
| Maximum | 16.5% | 7.0% |
| Range | 14.2% | 5.6% |
| Mean | 6.7% | 3.2% |
| Median | 5.8% | 2.9% |
| Interquartile 25% (IQ1) | 5.1% | 2.5% |
| Interquartile 75% (IQ3) | 7.9% | 3.6% |
| Interquartile Range (IQR) | 2.8% | 1.1% |
| Standard Deviation (Sample) | 2.8% | 1.2% |
| Standard Deviation (Population) | 2.8% | 1.2% |
Similar Demographics by Hearing Disability
Demographics Similar to Osage by Hearing Disability
In terms of hearing disability, the demographic groups most similar to Osage are Apache (4.1%, a difference of 0.070%), Seminole (4.1%, a difference of 0.19%), Lumbee (4.1%, a difference of 0.32%), Paiute (4.1%, a difference of 0.45%), and Potawatomi (4.1%, a difference of 0.61%).
| Demographics | Rating | Rank | Hearing Disability |
| Comanche | 0.0 /100 | #317 | Tragic 4.0% |
| Cheyenne | 0.0 /100 | #318 | Tragic 4.0% |
| Chippewa | 0.0 /100 | #319 | Tragic 4.0% |
| Shoshone | 0.0 /100 | #320 | Tragic 4.0% |
| Paiute | 0.0 /100 | #321 | Tragic 4.1% |
| Seminole | 0.0 /100 | #322 | Tragic 4.1% |
| Apache | 0.0 /100 | #323 | Tragic 4.1% |
| Osage | 0.0 /100 | #324 | Tragic 4.1% |
| Lumbee | 0.0 /100 | #325 | Tragic 4.1% |
| Potawatomi | 0.0 /100 | #326 | Tragic 4.1% |
| Arapaho | 0.0 /100 | #327 | Tragic 4.1% |
| Tohono O'odham | 0.0 /100 | #328 | Tragic 4.2% |
| Crow | 0.0 /100 | #329 | Tragic 4.2% |
| Natives/Alaskans | 0.0 /100 | #330 | Tragic 4.2% |
| Cherokee | 0.0 /100 | #331 | Tragic 4.2% |
Demographics Similar to Kenyans by Hearing Disability
In terms of hearing disability, the demographic groups most similar to Kenyans are Zimbabwean (2.8%, a difference of 0.020%), Immigrants from Liberia (2.8%, a difference of 0.030%), Jordanian (2.8%, a difference of 0.090%), Immigrants (2.8%, a difference of 0.12%), and Cuban (2.8%, a difference of 0.12%).
| Demographics | Rating | Rank | Hearing Disability |
| U.S. Virgin Islanders | 92.5 /100 | #112 | Exceptional 2.8% |
| Immigrants | Belarus | 91.6 /100 | #113 | Exceptional 2.8% |
| Cambodians | 91.1 /100 | #114 | Exceptional 2.8% |
| Immigrants | Latin America | 90.5 /100 | #115 | Exceptional 2.8% |
| Immigrants | Immigrants | 90.3 /100 | #116 | Exceptional 2.8% |
| Immigrants | Liberia | 90.0 /100 | #117 | Excellent 2.8% |
| Zimbabweans | 89.9 /100 | #118 | Excellent 2.8% |
| Kenyans | 89.8 /100 | #119 | Excellent 2.8% |
| Jordanians | 89.5 /100 | #120 | Excellent 2.8% |
| Cubans | 89.4 /100 | #121 | Excellent 2.8% |
| Liberians | 89.0 /100 | #122 | Excellent 2.8% |
| Immigrants | Zaire | 88.6 /100 | #123 | Excellent 2.9% |
| Bahamians | 88.6 /100 | #124 | Excellent 2.9% |
| Immigrants | Albania | 88.5 /100 | #125 | Excellent 2.9% |
| Immigrants | Sudan | 87.8 /100 | #126 | Excellent 2.9% |