Norwegian vs Tongan Disability Age 5 to 17
COMPARE
Norwegian
Tongan
Disability Age 5 to 17
Disability Age 5 to 17 Comparison
Norwegians
Tongans
5.7%
DISABILITY AGE 5 TO 17
20.9/ 100
METRIC RATING
198th/ 347
METRIC RANK
5.0%
DISABILITY AGE 5 TO 17
100.0/ 100
METRIC RATING
45th/ 347
METRIC RANK
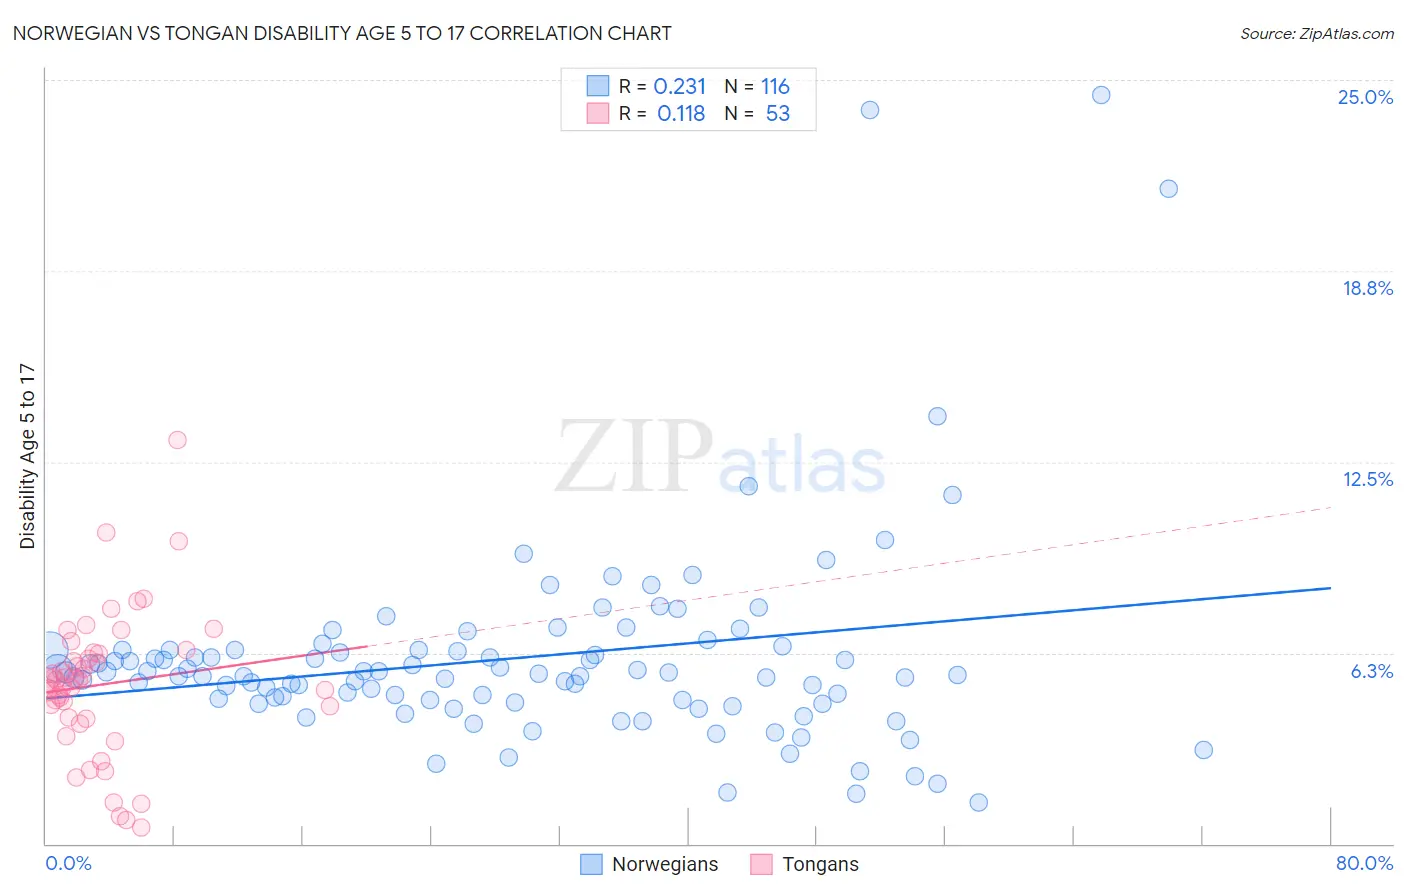
Norwegian vs Tongan Disability Age 5 to 17 Correlation Chart
The statistical analysis conducted on geographies consisting of 523,039,839 people shows a weak positive correlation between the proportion of Norwegians and percentage of population with a disability between the ages 5 and 17 in the United States with a correlation coefficient (R) of 0.231 and weighted average of 5.7%. Similarly, the statistical analysis conducted on geographies consisting of 102,679,280 people shows a poor positive correlation between the proportion of Tongans and percentage of population with a disability between the ages 5 and 17 in the United States with a correlation coefficient (R) of 0.118 and weighted average of 5.0%, a difference of 12.9%.
Disability Age 5 to 17 Correlation Summary
| Measurement | Norwegian | Tongan |
| Minimum | 1.4% | 0.54% |
| Maximum | 24.5% | 13.2% |
| Range | 23.2% | 12.7% |
| Mean | 6.1% | 5.2% |
| Median | 5.5% | 5.4% |
| Interquartile 25% (IQ1) | 4.7% | 4.1% |
| Interquartile 75% (IQ3) | 6.3% | 6.2% |
| Interquartile Range (IQR) | 1.6% | 2.1% |
| Standard Deviation (Sample) | 3.4% | 2.4% |
| Standard Deviation (Population) | 3.4% | 2.3% |
Similar Demographics by Disability Age 5 to 17
Demographics Similar to Norwegians by Disability Age 5 to 17
In terms of disability age 5 to 17, the demographic groups most similar to Norwegians are Immigrants from North America (5.7%, a difference of 0.16%), Inupiat (5.7%, a difference of 0.17%), Immigrants from Nigeria (5.7%, a difference of 0.18%), Croatian (5.7%, a difference of 0.19%), and Immigrants from Canada (5.7%, a difference of 0.35%).
| Demographics | Rating | Rank | Disability Age 5 to 17 |
| Danes | 26.5 /100 | #191 | Fair 5.7% |
| Immigrants | Bosnia and Herzegovina | 26.3 /100 | #192 | Fair 5.7% |
| Immigrants | Canada | 26.1 /100 | #193 | Fair 5.7% |
| Croatians | 23.6 /100 | #194 | Fair 5.7% |
| Immigrants | Nigeria | 23.4 /100 | #195 | Fair 5.7% |
| Inupiat | 23.3 /100 | #196 | Fair 5.7% |
| Immigrants | North America | 23.1 /100 | #197 | Fair 5.7% |
| Norwegians | 20.9 /100 | #198 | Fair 5.7% |
| Northern Europeans | 15.2 /100 | #199 | Poor 5.7% |
| Icelanders | 14.6 /100 | #200 | Poor 5.7% |
| Basques | 13.7 /100 | #201 | Poor 5.7% |
| Austrians | 13.2 /100 | #202 | Poor 5.7% |
| Spanish American Indians | 12.8 /100 | #203 | Poor 5.7% |
| Paiute | 11.2 /100 | #204 | Poor 5.7% |
| Trinidadians and Tobagonians | 10.8 /100 | #205 | Poor 5.7% |
Demographics Similar to Tongans by Disability Age 5 to 17
In terms of disability age 5 to 17, the demographic groups most similar to Tongans are Egyptian (5.0%, a difference of 0.070%), Assyrian/Chaldean/Syriac (5.0%, a difference of 0.070%), Immigrants from Russia (5.0%, a difference of 0.11%), Vietnamese (5.1%, a difference of 0.19%), and Korean (5.1%, a difference of 0.38%).
| Demographics | Rating | Rank | Disability Age 5 to 17 |
| Immigrants | Philippines | 100.0 /100 | #38 | Exceptional 5.0% |
| Immigrants | Argentina | 100.0 /100 | #39 | Exceptional 5.0% |
| Okinawans | 100.0 /100 | #40 | Exceptional 5.0% |
| Immigrants | Australia | 100.0 /100 | #41 | Exceptional 5.0% |
| Immigrants | Sri Lanka | 100.0 /100 | #42 | Exceptional 5.0% |
| Immigrants | Russia | 100.0 /100 | #43 | Exceptional 5.0% |
| Egyptians | 100.0 /100 | #44 | Exceptional 5.0% |
| Tongans | 100.0 /100 | #45 | Exceptional 5.0% |
| Assyrians/Chaldeans/Syriacs | 100.0 /100 | #46 | Exceptional 5.0% |
| Vietnamese | 100.0 /100 | #47 | Exceptional 5.1% |
| Koreans | 100.0 /100 | #48 | Exceptional 5.1% |
| Immigrants | Western Asia | 100.0 /100 | #49 | Exceptional 5.1% |
| Argentineans | 99.9 /100 | #50 | Exceptional 5.1% |
| Turks | 99.9 /100 | #51 | Exceptional 5.1% |
| Immigrants | Fiji | 99.9 /100 | #52 | Exceptional 5.1% |