Sierra Leonean vs Tongan Disability Age 5 to 17
COMPARE
Sierra Leonean
Tongan
Disability Age 5 to 17
Disability Age 5 to 17 Comparison
Sierra Leoneans
Tongans
5.8%
DISABILITY AGE 5 TO 17
7.0/ 100
METRIC RATING
219th/ 347
METRIC RANK
5.0%
DISABILITY AGE 5 TO 17
100.0/ 100
METRIC RATING
45th/ 347
METRIC RANK
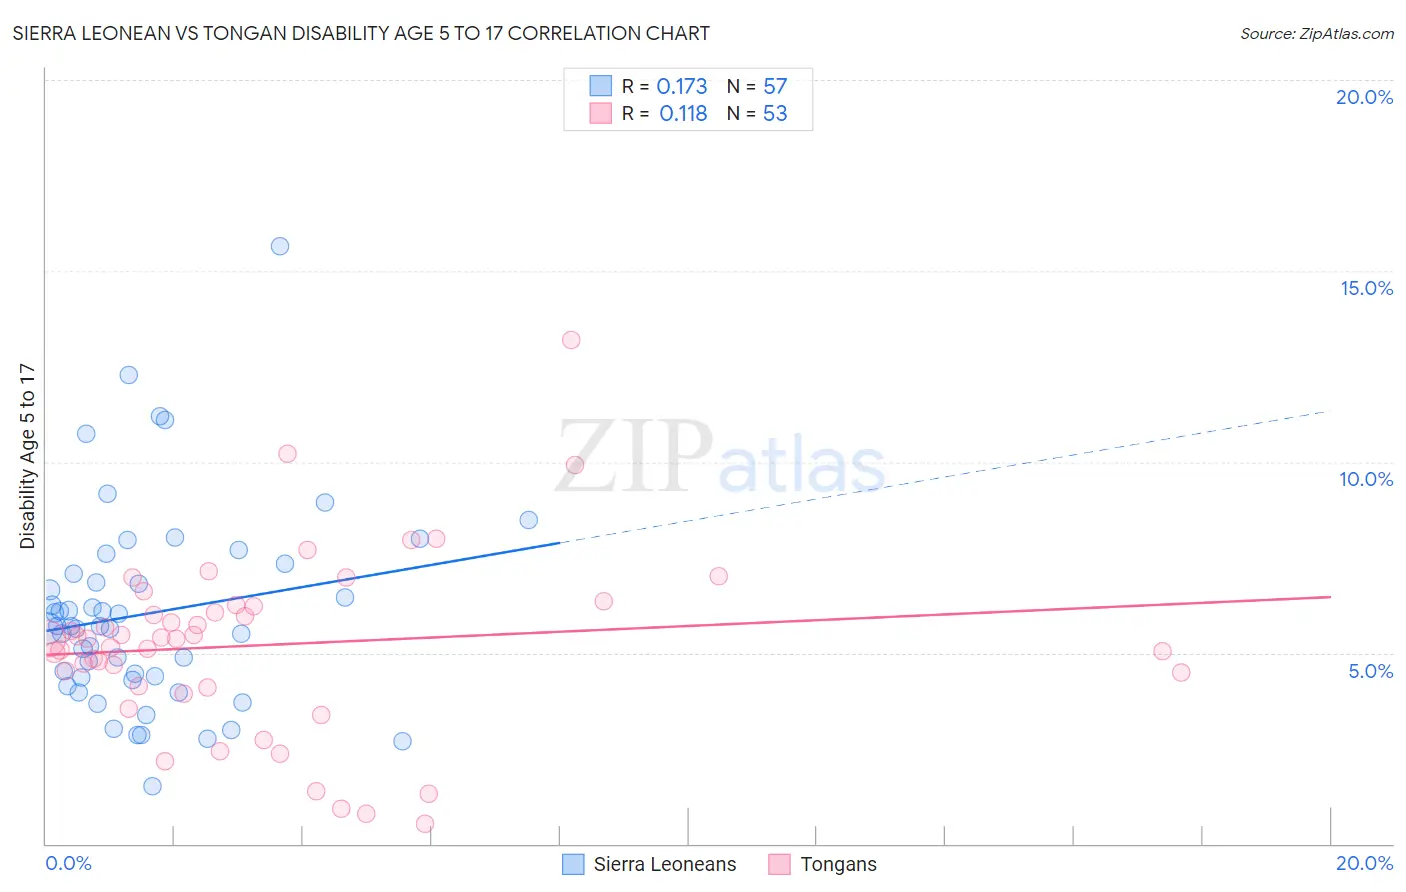
Sierra Leonean vs Tongan Disability Age 5 to 17 Correlation Chart
The statistical analysis conducted on geographies consisting of 83,260,070 people shows a poor positive correlation between the proportion of Sierra Leoneans and percentage of population with a disability between the ages 5 and 17 in the United States with a correlation coefficient (R) of 0.173 and weighted average of 5.8%. Similarly, the statistical analysis conducted on geographies consisting of 102,679,280 people shows a poor positive correlation between the proportion of Tongans and percentage of population with a disability between the ages 5 and 17 in the United States with a correlation coefficient (R) of 0.118 and weighted average of 5.0%, a difference of 14.6%.
Disability Age 5 to 17 Correlation Summary
| Measurement | Sierra Leonean | Tongan |
| Minimum | 1.5% | 0.54% |
| Maximum | 15.7% | 13.2% |
| Range | 14.2% | 12.7% |
| Mean | 6.0% | 5.2% |
| Median | 5.7% | 5.4% |
| Interquartile 25% (IQ1) | 4.3% | 4.1% |
| Interquartile 75% (IQ3) | 7.2% | 6.2% |
| Interquartile Range (IQR) | 2.9% | 2.1% |
| Standard Deviation (Sample) | 2.6% | 2.4% |
| Standard Deviation (Population) | 2.6% | 2.3% |
Similar Demographics by Disability Age 5 to 17
Demographics Similar to Sierra Leoneans by Disability Age 5 to 17
In terms of disability age 5 to 17, the demographic groups most similar to Sierra Leoneans are Immigrants from Sierra Leone (5.8%, a difference of 0.010%), Belgian (5.8%, a difference of 0.010%), Lithuanian (5.8%, a difference of 0.050%), Czech (5.8%, a difference of 0.060%), and Immigrants from Sudan (5.8%, a difference of 0.060%).
| Demographics | Rating | Rank | Disability Age 5 to 17 |
| Immigrants | Panama | 8.7 /100 | #212 | Tragic 5.8% |
| Immigrants | Cameroon | 8.3 /100 | #213 | Tragic 5.8% |
| Immigrants | Morocco | 8.3 /100 | #214 | Tragic 5.8% |
| Swedes | 8.1 /100 | #215 | Tragic 5.8% |
| Nigerians | 7.5 /100 | #216 | Tragic 5.8% |
| Czechs | 7.4 /100 | #217 | Tragic 5.8% |
| Immigrants | Sierra Leone | 7.1 /100 | #218 | Tragic 5.8% |
| Sierra Leoneans | 7.0 /100 | #219 | Tragic 5.8% |
| Belgians | 6.9 /100 | #220 | Tragic 5.8% |
| Lithuanians | 6.7 /100 | #221 | Tragic 5.8% |
| Immigrants | Sudan | 6.7 /100 | #222 | Tragic 5.8% |
| Alsatians | 6.0 /100 | #223 | Tragic 5.8% |
| Mexicans | 5.7 /100 | #224 | Tragic 5.8% |
| Guamanians/Chamorros | 5.6 /100 | #225 | Tragic 5.8% |
| British West Indians | 5.4 /100 | #226 | Tragic 5.8% |
Demographics Similar to Tongans by Disability Age 5 to 17
In terms of disability age 5 to 17, the demographic groups most similar to Tongans are Egyptian (5.0%, a difference of 0.070%), Assyrian/Chaldean/Syriac (5.0%, a difference of 0.070%), Immigrants from Russia (5.0%, a difference of 0.11%), Vietnamese (5.1%, a difference of 0.19%), and Korean (5.1%, a difference of 0.38%).
| Demographics | Rating | Rank | Disability Age 5 to 17 |
| Immigrants | Philippines | 100.0 /100 | #38 | Exceptional 5.0% |
| Immigrants | Argentina | 100.0 /100 | #39 | Exceptional 5.0% |
| Okinawans | 100.0 /100 | #40 | Exceptional 5.0% |
| Immigrants | Australia | 100.0 /100 | #41 | Exceptional 5.0% |
| Immigrants | Sri Lanka | 100.0 /100 | #42 | Exceptional 5.0% |
| Immigrants | Russia | 100.0 /100 | #43 | Exceptional 5.0% |
| Egyptians | 100.0 /100 | #44 | Exceptional 5.0% |
| Tongans | 100.0 /100 | #45 | Exceptional 5.0% |
| Assyrians/Chaldeans/Syriacs | 100.0 /100 | #46 | Exceptional 5.0% |
| Vietnamese | 100.0 /100 | #47 | Exceptional 5.1% |
| Koreans | 100.0 /100 | #48 | Exceptional 5.1% |
| Immigrants | Western Asia | 100.0 /100 | #49 | Exceptional 5.1% |
| Argentineans | 99.9 /100 | #50 | Exceptional 5.1% |
| Turks | 99.9 /100 | #51 | Exceptional 5.1% |
| Immigrants | Fiji | 99.9 /100 | #52 | Exceptional 5.1% |