Egyptian vs Cuban Vision Disability
COMPARE
Egyptian
Cuban
Vision Disability
Vision Disability Comparison
Egyptians
Cubans
1.9%
VISION DISABILITY
99.9/ 100
METRIC RATING
29th/ 347
METRIC RANK
2.4%
VISION DISABILITY
0.1/ 100
METRIC RATING
270th/ 347
METRIC RANK
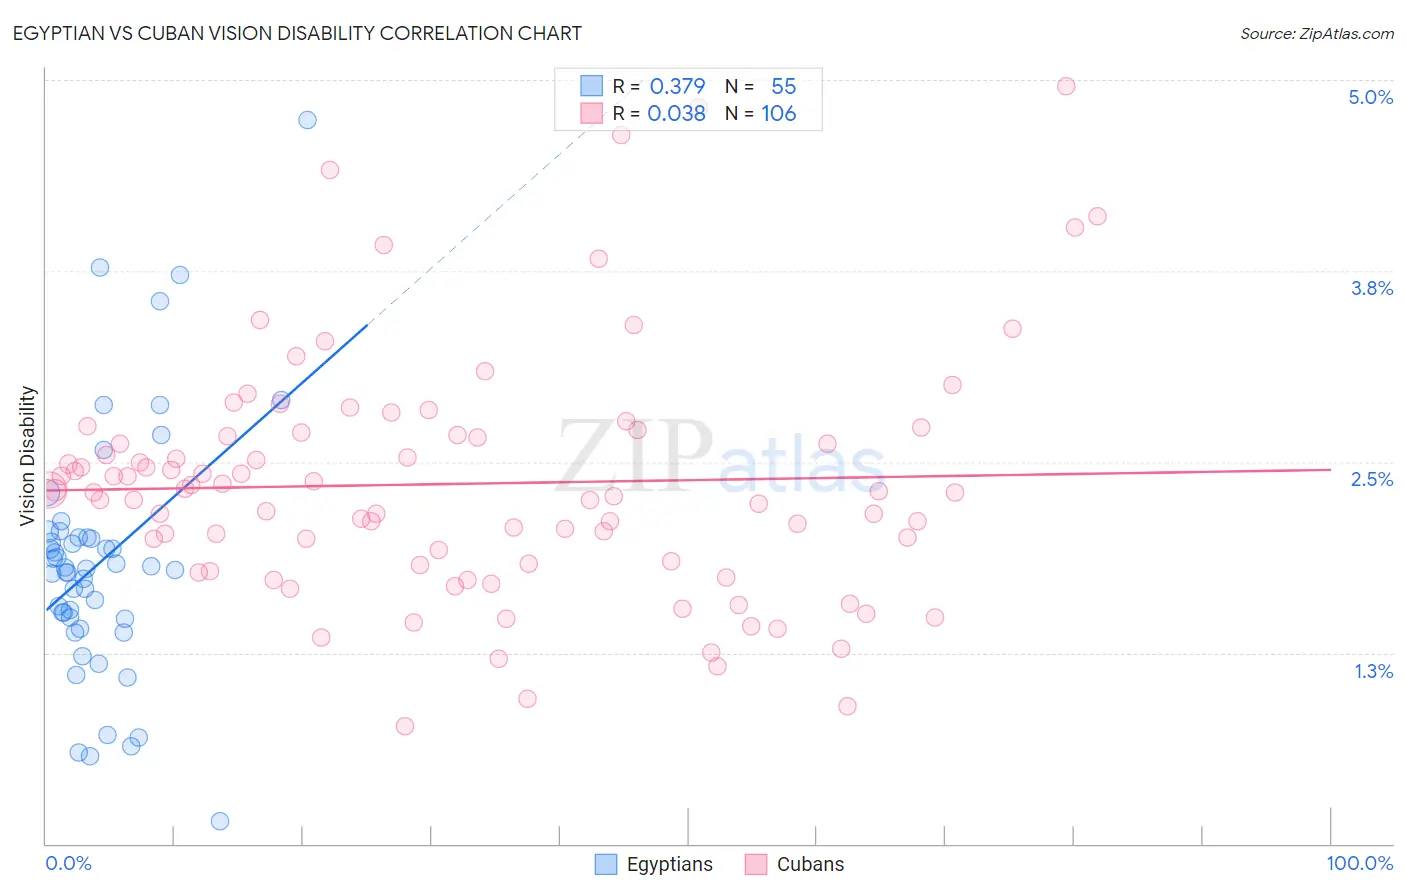
Egyptian vs Cuban Vision Disability Correlation Chart
The statistical analysis conducted on geographies consisting of 276,791,971 people shows a mild positive correlation between the proportion of Egyptians and percentage of population with vision disability in the United States with a correlation coefficient (R) of 0.379 and weighted average of 1.9%. Similarly, the statistical analysis conducted on geographies consisting of 448,885,451 people shows no correlation between the proportion of Cubans and percentage of population with vision disability in the United States with a correlation coefficient (R) of 0.038 and weighted average of 2.4%, a difference of 24.8%.
Vision Disability Correlation Summary
| Measurement | Egyptian | Cuban |
| Minimum | 0.14% | 0.77% |
| Maximum | 4.7% | 5.0% |
| Range | 4.6% | 4.2% |
| Mean | 1.9% | 2.4% |
| Median | 1.8% | 2.3% |
| Interquartile 25% (IQ1) | 1.5% | 1.8% |
| Interquartile 75% (IQ3) | 2.0% | 2.7% |
| Interquartile Range (IQR) | 0.54% | 0.85% |
| Standard Deviation (Sample) | 0.83% | 0.80% |
| Standard Deviation (Population) | 0.82% | 0.79% |
Similar Demographics by Vision Disability
Demographics Similar to Egyptians by Vision Disability
In terms of vision disability, the demographic groups most similar to Egyptians are Immigrants from Nepal (1.9%, a difference of 0.040%), Immigrants from Malaysia (1.9%, a difference of 0.070%), Taiwanese (1.9%, a difference of 0.090%), Mongolian (1.9%, a difference of 0.20%), and Immigrants from Japan (1.9%, a difference of 0.43%).
| Demographics | Rating | Rank | Vision Disability |
| Immigrants | Pakistan | 100.0 /100 | #22 | Exceptional 1.9% |
| Immigrants | Asia | 99.9 /100 | #23 | Exceptional 1.9% |
| Immigrants | Lithuania | 99.9 /100 | #24 | Exceptional 1.9% |
| Bulgarians | 99.9 /100 | #25 | Exceptional 1.9% |
| Immigrants | Japan | 99.9 /100 | #26 | Exceptional 1.9% |
| Taiwanese | 99.9 /100 | #27 | Exceptional 1.9% |
| Immigrants | Malaysia | 99.9 /100 | #28 | Exceptional 1.9% |
| Egyptians | 99.9 /100 | #29 | Exceptional 1.9% |
| Immigrants | Nepal | 99.9 /100 | #30 | Exceptional 1.9% |
| Mongolians | 99.9 /100 | #31 | Exceptional 1.9% |
| Luxembourgers | 99.9 /100 | #32 | Exceptional 1.9% |
| Immigrants | Egypt | 99.9 /100 | #33 | Exceptional 1.9% |
| Immigrants | Turkey | 99.8 /100 | #34 | Exceptional 1.9% |
| Immigrants | Australia | 99.8 /100 | #35 | Exceptional 1.9% |
| Cambodians | 99.8 /100 | #36 | Exceptional 2.0% |
Demographics Similar to Cubans by Vision Disability
In terms of vision disability, the demographic groups most similar to Cubans are Celtic (2.4%, a difference of 0.010%), Immigrants from the Azores (2.4%, a difference of 0.16%), Spaniard (2.4%, a difference of 0.26%), Senegalese (2.4%, a difference of 0.28%), and Ute (2.4%, a difference of 0.37%).
| Demographics | Rating | Rank | Vision Disability |
| Immigrants | Belize | 0.1 /100 | #263 | Tragic 2.4% |
| Immigrants | Liberia | 0.1 /100 | #264 | Tragic 2.4% |
| Immigrants | Jamaica | 0.1 /100 | #265 | Tragic 2.4% |
| Mexican American Indians | 0.1 /100 | #266 | Tragic 2.4% |
| Ute | 0.1 /100 | #267 | Tragic 2.4% |
| Senegalese | 0.1 /100 | #268 | Tragic 2.4% |
| Celtics | 0.1 /100 | #269 | Tragic 2.4% |
| Cubans | 0.1 /100 | #270 | Tragic 2.4% |
| Immigrants | Azores | 0.1 /100 | #271 | Tragic 2.4% |
| Spaniards | 0.1 /100 | #272 | Tragic 2.4% |
| Immigrants | Bahamas | 0.1 /100 | #273 | Tragic 2.4% |
| Immigrants | Latin America | 0.0 /100 | #274 | Tragic 2.4% |
| Chippewa | 0.0 /100 | #275 | Tragic 2.4% |
| Scotch-Irish | 0.0 /100 | #276 | Tragic 2.4% |
| Bahamians | 0.0 /100 | #277 | Tragic 2.4% |