Norwegian vs Luxembourger Vision Disability
COMPARE
Norwegian
Luxembourger
Vision Disability
Vision Disability Comparison
Norwegians
Luxembourgers
2.0%
VISION DISABILITY
97.0/ 100
METRIC RATING
88th/ 347
METRIC RANK
1.9%
VISION DISABILITY
99.9/ 100
METRIC RATING
32nd/ 347
METRIC RANK
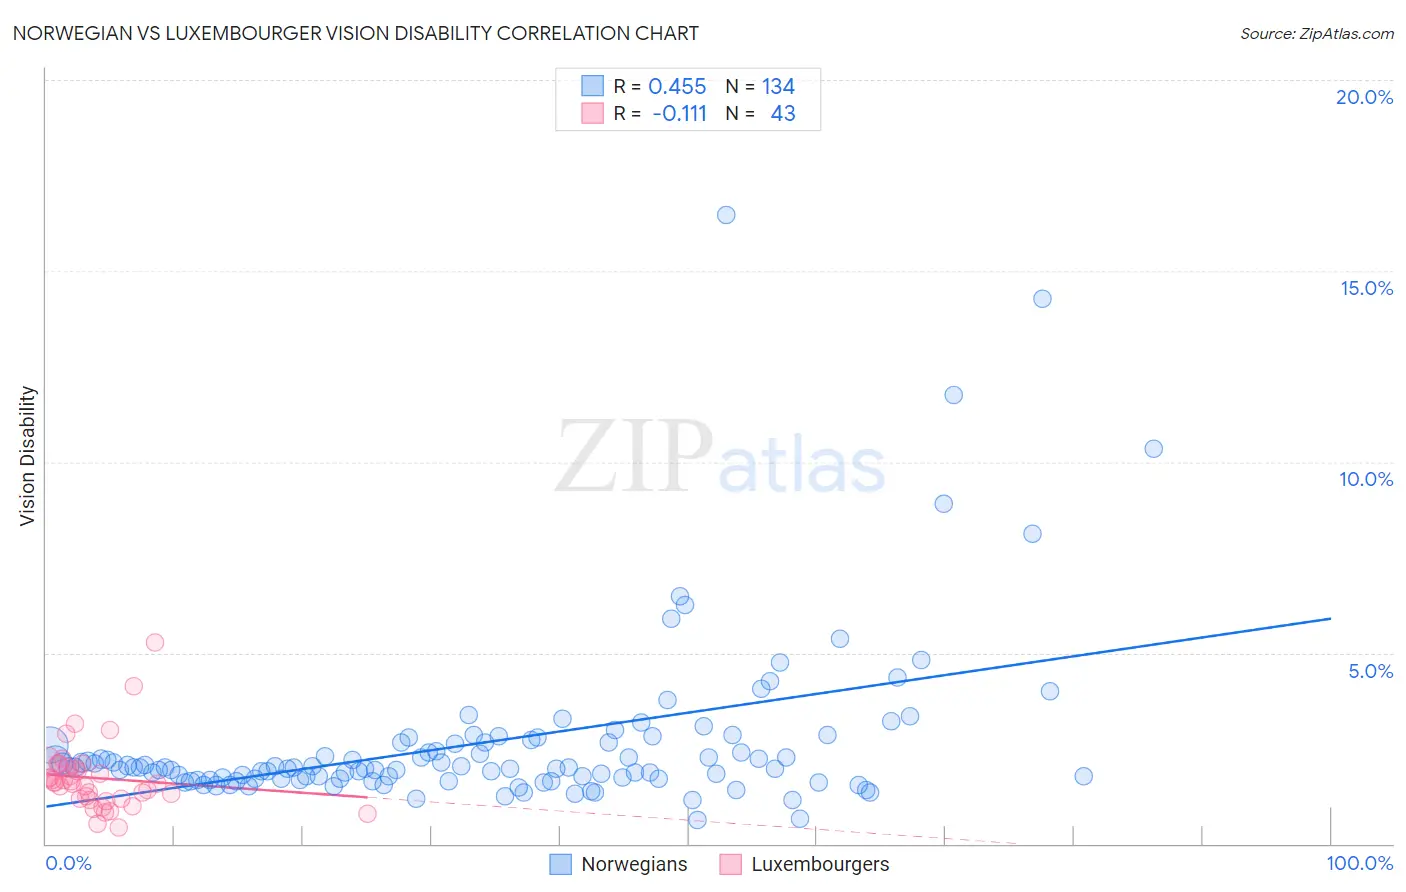
Norwegian vs Luxembourger Vision Disability Correlation Chart
The statistical analysis conducted on geographies consisting of 532,008,287 people shows a moderate positive correlation between the proportion of Norwegians and percentage of population with vision disability in the United States with a correlation coefficient (R) of 0.455 and weighted average of 2.0%. Similarly, the statistical analysis conducted on geographies consisting of 144,652,316 people shows a poor negative correlation between the proportion of Luxembourgers and percentage of population with vision disability in the United States with a correlation coefficient (R) of -0.111 and weighted average of 1.9%, a difference of 5.6%.
Vision Disability Correlation Summary
| Measurement | Norwegian | Luxembourger |
| Minimum | 0.63% | 0.43% |
| Maximum | 16.5% | 5.3% |
| Range | 15.8% | 4.8% |
| Mean | 2.7% | 1.7% |
| Median | 2.0% | 1.6% |
| Interquartile 25% (IQ1) | 1.7% | 1.2% |
| Interquartile 75% (IQ3) | 2.7% | 2.0% |
| Interquartile Range (IQR) | 0.95% | 0.84% |
| Standard Deviation (Sample) | 2.3% | 0.90% |
| Standard Deviation (Population) | 2.3% | 0.89% |
Similar Demographics by Vision Disability
Demographics Similar to Norwegians by Vision Disability
In terms of vision disability, the demographic groups most similar to Norwegians are Immigrants from Switzerland (2.0%, a difference of 0.010%), Immigrants from Eastern Africa (2.0%, a difference of 0.040%), Immigrants from Moldova (2.0%, a difference of 0.070%), Chinese (2.0%, a difference of 0.10%), and Immigrants from Latvia (2.0%, a difference of 0.15%).
| Demographics | Rating | Rank | Vision Disability |
| Soviet Union | 97.6 /100 | #81 | Exceptional 2.0% |
| Immigrants | Poland | 97.6 /100 | #82 | Exceptional 2.0% |
| Immigrants | Western Asia | 97.5 /100 | #83 | Exceptional 2.0% |
| Immigrants | Latvia | 97.3 /100 | #84 | Exceptional 2.0% |
| Chinese | 97.2 /100 | #85 | Exceptional 2.0% |
| Immigrants | Moldova | 97.2 /100 | #86 | Exceptional 2.0% |
| Immigrants | Switzerland | 97.0 /100 | #87 | Exceptional 2.0% |
| Norwegians | 97.0 /100 | #88 | Exceptional 2.0% |
| Immigrants | Eastern Africa | 97.0 /100 | #89 | Exceptional 2.0% |
| Immigrants | Lebanon | 96.7 /100 | #90 | Exceptional 2.1% |
| Immigrants | Somalia | 96.2 /100 | #91 | Exceptional 2.1% |
| Immigrants | Syria | 96.2 /100 | #92 | Exceptional 2.1% |
| Immigrants | Europe | 96.1 /100 | #93 | Exceptional 2.1% |
| Immigrants | Croatia | 96.0 /100 | #94 | Exceptional 2.1% |
| Australians | 95.9 /100 | #95 | Exceptional 2.1% |
Demographics Similar to Luxembourgers by Vision Disability
In terms of vision disability, the demographic groups most similar to Luxembourgers are Mongolian (1.9%, a difference of 0.27%), Immigrants from Egypt (1.9%, a difference of 0.31%), Immigrants from Nepal (1.9%, a difference of 0.43%), Immigrants from Turkey (1.9%, a difference of 0.43%), and Egyptian (1.9%, a difference of 0.47%).
| Demographics | Rating | Rank | Vision Disability |
| Bulgarians | 99.9 /100 | #25 | Exceptional 1.9% |
| Immigrants | Japan | 99.9 /100 | #26 | Exceptional 1.9% |
| Taiwanese | 99.9 /100 | #27 | Exceptional 1.9% |
| Immigrants | Malaysia | 99.9 /100 | #28 | Exceptional 1.9% |
| Egyptians | 99.9 /100 | #29 | Exceptional 1.9% |
| Immigrants | Nepal | 99.9 /100 | #30 | Exceptional 1.9% |
| Mongolians | 99.9 /100 | #31 | Exceptional 1.9% |
| Luxembourgers | 99.9 /100 | #32 | Exceptional 1.9% |
| Immigrants | Egypt | 99.9 /100 | #33 | Exceptional 1.9% |
| Immigrants | Turkey | 99.8 /100 | #34 | Exceptional 1.9% |
| Immigrants | Australia | 99.8 /100 | #35 | Exceptional 1.9% |
| Cambodians | 99.8 /100 | #36 | Exceptional 2.0% |
| Bhutanese | 99.8 /100 | #37 | Exceptional 2.0% |
| Immigrants | Kuwait | 99.8 /100 | #38 | Exceptional 2.0% |
| Zimbabweans | 99.7 /100 | #39 | Exceptional 2.0% |