Norwegian vs Welsh Vision Disability
COMPARE
Norwegian
Welsh
Vision Disability
Vision Disability Comparison
Norwegians
Welsh
2.0%
VISION DISABILITY
97.0/ 100
METRIC RATING
88th/ 347
METRIC RANK
2.3%
VISION DISABILITY
2.3/ 100
METRIC RATING
229th/ 347
METRIC RANK
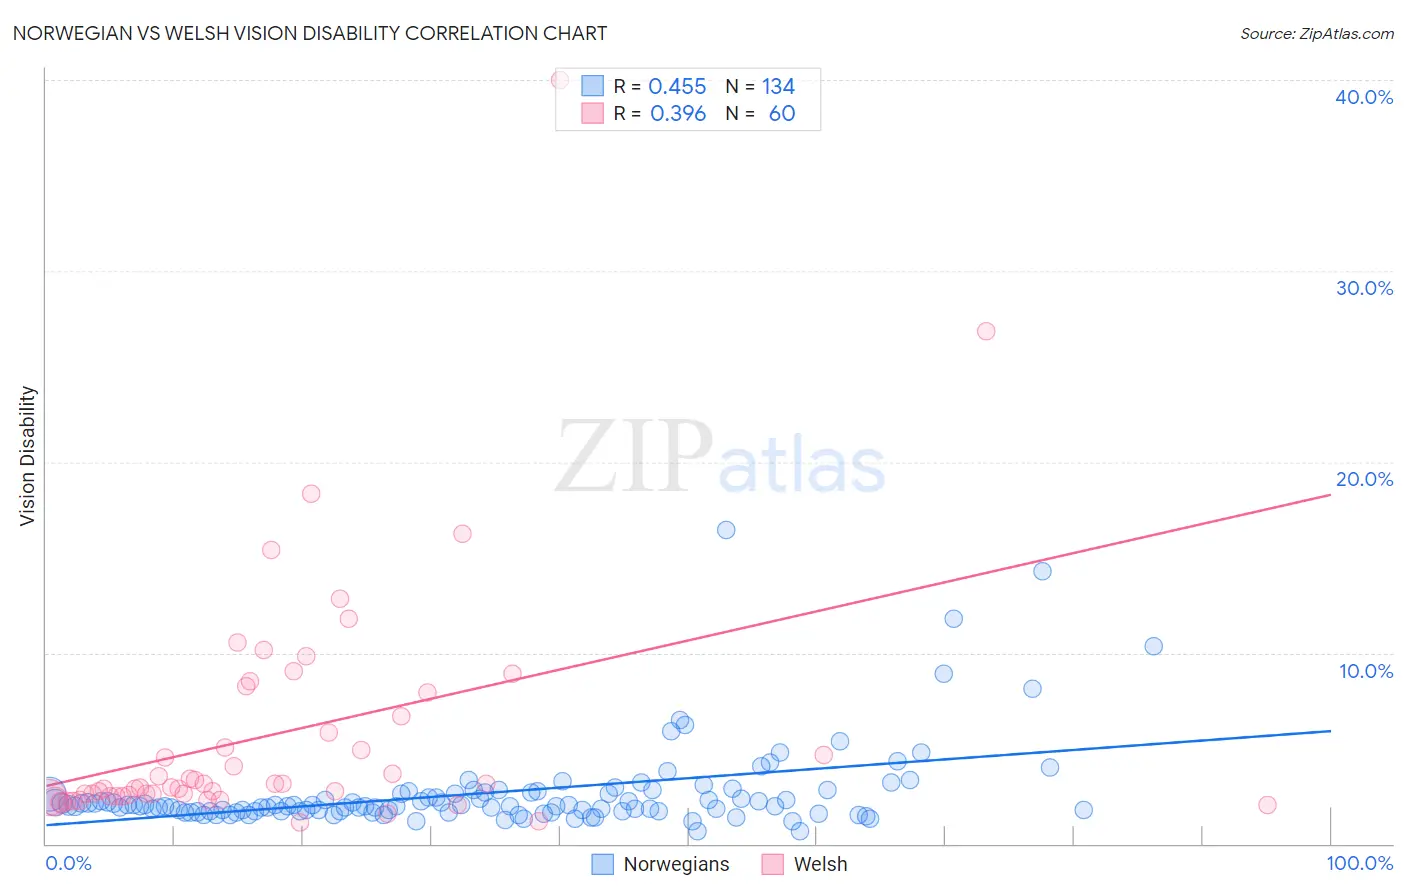
Norwegian vs Welsh Vision Disability Correlation Chart
The statistical analysis conducted on geographies consisting of 532,008,287 people shows a moderate positive correlation between the proportion of Norwegians and percentage of population with vision disability in the United States with a correlation coefficient (R) of 0.455 and weighted average of 2.0%. Similarly, the statistical analysis conducted on geographies consisting of 527,426,081 people shows a mild positive correlation between the proportion of Welsh and percentage of population with vision disability in the United States with a correlation coefficient (R) of 0.396 and weighted average of 2.3%, a difference of 12.0%.
Vision Disability Correlation Summary
| Measurement | Norwegian | Welsh |
| Minimum | 0.63% | 1.1% |
| Maximum | 16.5% | 40.0% |
| Range | 15.8% | 38.9% |
| Mean | 2.7% | 5.8% |
| Median | 2.0% | 3.0% |
| Interquartile 25% (IQ1) | 1.7% | 2.5% |
| Interquartile 75% (IQ3) | 2.7% | 7.3% |
| Interquartile Range (IQR) | 0.95% | 4.8% |
| Standard Deviation (Sample) | 2.3% | 6.6% |
| Standard Deviation (Population) | 2.3% | 6.5% |
Similar Demographics by Vision Disability
Demographics Similar to Norwegians by Vision Disability
In terms of vision disability, the demographic groups most similar to Norwegians are Immigrants from Switzerland (2.0%, a difference of 0.010%), Immigrants from Eastern Africa (2.0%, a difference of 0.040%), Immigrants from Moldova (2.0%, a difference of 0.070%), Chinese (2.0%, a difference of 0.10%), and Immigrants from Latvia (2.0%, a difference of 0.15%).
| Demographics | Rating | Rank | Vision Disability |
| Soviet Union | 97.6 /100 | #81 | Exceptional 2.0% |
| Immigrants | Poland | 97.6 /100 | #82 | Exceptional 2.0% |
| Immigrants | Western Asia | 97.5 /100 | #83 | Exceptional 2.0% |
| Immigrants | Latvia | 97.3 /100 | #84 | Exceptional 2.0% |
| Chinese | 97.2 /100 | #85 | Exceptional 2.0% |
| Immigrants | Moldova | 97.2 /100 | #86 | Exceptional 2.0% |
| Immigrants | Switzerland | 97.0 /100 | #87 | Exceptional 2.0% |
| Norwegians | 97.0 /100 | #88 | Exceptional 2.0% |
| Immigrants | Eastern Africa | 97.0 /100 | #89 | Exceptional 2.0% |
| Immigrants | Lebanon | 96.7 /100 | #90 | Exceptional 2.1% |
| Immigrants | Somalia | 96.2 /100 | #91 | Exceptional 2.1% |
| Immigrants | Syria | 96.2 /100 | #92 | Exceptional 2.1% |
| Immigrants | Europe | 96.1 /100 | #93 | Exceptional 2.1% |
| Immigrants | Croatia | 96.0 /100 | #94 | Exceptional 2.1% |
| Australians | 95.9 /100 | #95 | Exceptional 2.1% |
Demographics Similar to Welsh by Vision Disability
In terms of vision disability, the demographic groups most similar to Welsh are Nicaraguan (2.3%, a difference of 0.070%), Hmong (2.3%, a difference of 0.080%), Immigrants from Ecuador (2.3%, a difference of 0.23%), Hawaiian (2.3%, a difference of 0.32%), and Immigrants from Germany (2.3%, a difference of 0.37%).
| Demographics | Rating | Rank | Vision Disability |
| Immigrants | Senegal | 3.8 /100 | #222 | Tragic 2.3% |
| Basques | 3.5 /100 | #223 | Tragic 2.3% |
| Irish | 3.4 /100 | #224 | Tragic 2.3% |
| Immigrants | Western Africa | 3.4 /100 | #225 | Tragic 2.3% |
| Immigrants | Germany | 3.0 /100 | #226 | Tragic 2.3% |
| Hawaiians | 2.9 /100 | #227 | Tragic 2.3% |
| Hmong | 2.5 /100 | #228 | Tragic 2.3% |
| Welsh | 2.3 /100 | #229 | Tragic 2.3% |
| Nicaraguans | 2.2 /100 | #230 | Tragic 2.3% |
| Immigrants | Ecuador | 2.0 /100 | #231 | Tragic 2.3% |
| German Russians | 1.8 /100 | #232 | Tragic 2.3% |
| Central Americans | 1.8 /100 | #233 | Tragic 2.3% |
| Scottish | 1.6 /100 | #234 | Tragic 2.3% |
| Marshallese | 1.5 /100 | #235 | Tragic 2.3% |
| Immigrants | Congo | 1.4 /100 | #236 | Tragic 2.3% |