Blackfeet vs Cuban Vision Disability
COMPARE
Blackfeet
Cuban
Vision Disability
Vision Disability Comparison
Blackfeet
Cubans
2.6%
VISION DISABILITY
0.0/ 100
METRIC RATING
310th/ 347
METRIC RANK
2.4%
VISION DISABILITY
0.1/ 100
METRIC RATING
270th/ 347
METRIC RANK
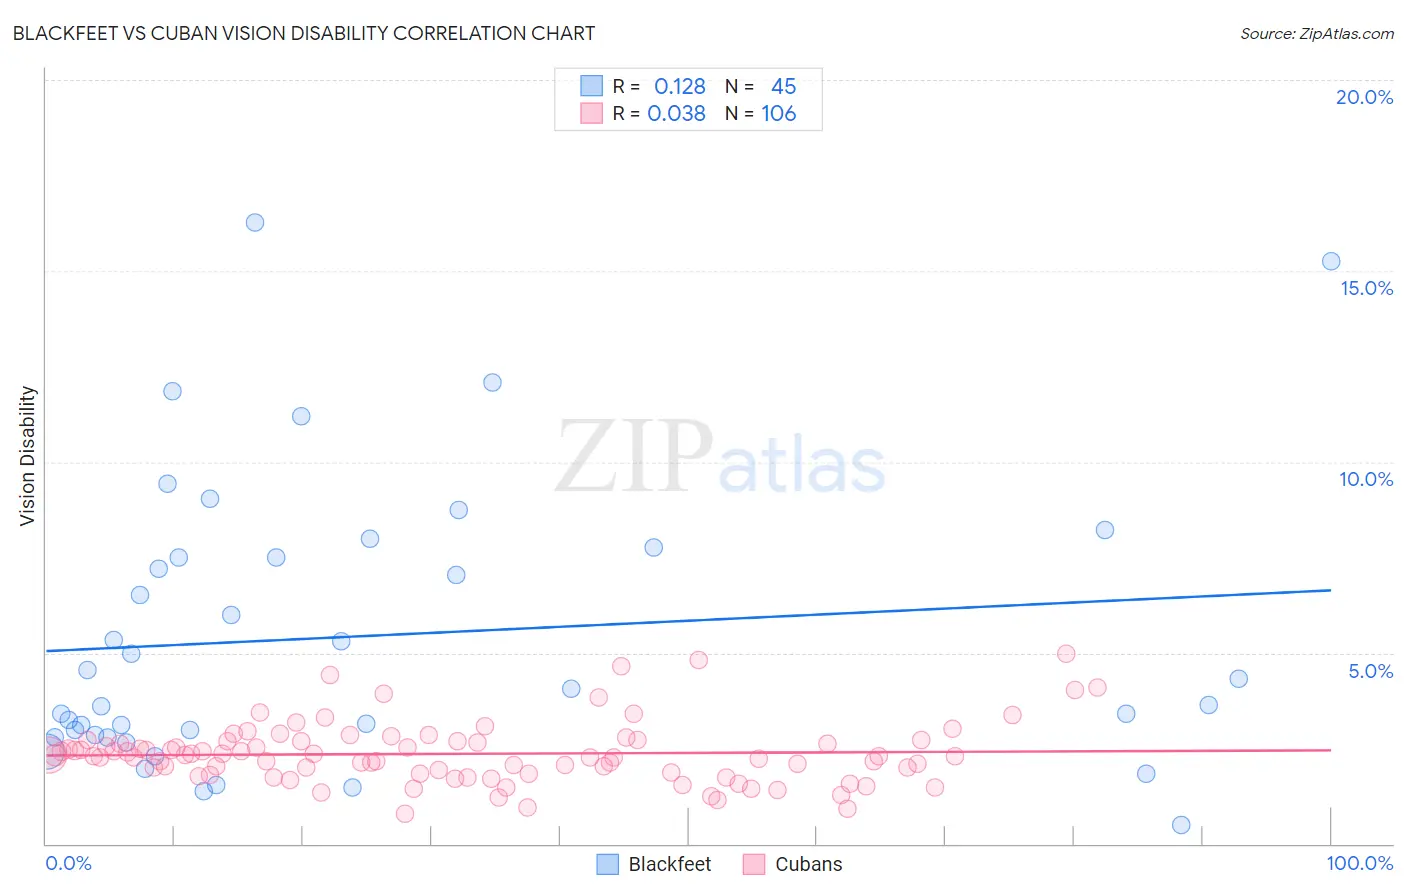
Blackfeet vs Cuban Vision Disability Correlation Chart
The statistical analysis conducted on geographies consisting of 309,368,120 people shows a poor positive correlation between the proportion of Blackfeet and percentage of population with vision disability in the United States with a correlation coefficient (R) of 0.128 and weighted average of 2.6%. Similarly, the statistical analysis conducted on geographies consisting of 448,885,451 people shows no correlation between the proportion of Cubans and percentage of population with vision disability in the United States with a correlation coefficient (R) of 0.038 and weighted average of 2.4%, a difference of 9.0%.
Vision Disability Correlation Summary
| Measurement | Blackfeet | Cuban |
| Minimum | 0.51% | 0.77% |
| Maximum | 16.3% | 5.0% |
| Range | 15.8% | 4.2% |
| Mean | 5.4% | 2.4% |
| Median | 4.1% | 2.3% |
| Interquartile 25% (IQ1) | 2.8% | 1.8% |
| Interquartile 75% (IQ3) | 7.6% | 2.7% |
| Interquartile Range (IQR) | 4.8% | 0.85% |
| Standard Deviation (Sample) | 3.7% | 0.80% |
| Standard Deviation (Population) | 3.7% | 0.79% |
Similar Demographics by Vision Disability
Demographics Similar to Blackfeet by Vision Disability
In terms of vision disability, the demographic groups most similar to Blackfeet are Dominican (2.6%, a difference of 0.040%), Immigrants from Yemen (2.6%, a difference of 0.32%), Arapaho (2.6%, a difference of 0.61%), Immigrants from Dominican Republic (2.6%, a difference of 0.63%), and Iroquois (2.6%, a difference of 0.65%).
| Demographics | Rating | Rank | Vision Disability |
| Immigrants | Cabo Verde | 0.0 /100 | #303 | Tragic 2.6% |
| Aleuts | 0.0 /100 | #304 | Tragic 2.6% |
| Hispanics or Latinos | 0.0 /100 | #305 | Tragic 2.6% |
| Iroquois | 0.0 /100 | #306 | Tragic 2.6% |
| Immigrants | Dominican Republic | 0.0 /100 | #307 | Tragic 2.6% |
| Arapaho | 0.0 /100 | #308 | Tragic 2.6% |
| Immigrants | Yemen | 0.0 /100 | #309 | Tragic 2.6% |
| Blackfeet | 0.0 /100 | #310 | Tragic 2.6% |
| Dominicans | 0.0 /100 | #311 | Tragic 2.6% |
| Americans | 0.0 /100 | #312 | Tragic 2.6% |
| Potawatomi | 0.0 /100 | #313 | Tragic 2.6% |
| Inupiat | 0.0 /100 | #314 | Tragic 2.7% |
| Osage | 0.0 /100 | #315 | Tragic 2.7% |
| Shoshone | 0.0 /100 | #316 | Tragic 2.7% |
| Yup'ik | 0.0 /100 | #317 | Tragic 2.7% |
Demographics Similar to Cubans by Vision Disability
In terms of vision disability, the demographic groups most similar to Cubans are Celtic (2.4%, a difference of 0.010%), Immigrants from the Azores (2.4%, a difference of 0.16%), Spaniard (2.4%, a difference of 0.26%), Senegalese (2.4%, a difference of 0.28%), and Ute (2.4%, a difference of 0.37%).
| Demographics | Rating | Rank | Vision Disability |
| Immigrants | Belize | 0.1 /100 | #263 | Tragic 2.4% |
| Immigrants | Liberia | 0.1 /100 | #264 | Tragic 2.4% |
| Immigrants | Jamaica | 0.1 /100 | #265 | Tragic 2.4% |
| Mexican American Indians | 0.1 /100 | #266 | Tragic 2.4% |
| Ute | 0.1 /100 | #267 | Tragic 2.4% |
| Senegalese | 0.1 /100 | #268 | Tragic 2.4% |
| Celtics | 0.1 /100 | #269 | Tragic 2.4% |
| Cubans | 0.1 /100 | #270 | Tragic 2.4% |
| Immigrants | Azores | 0.1 /100 | #271 | Tragic 2.4% |
| Spaniards | 0.1 /100 | #272 | Tragic 2.4% |
| Immigrants | Bahamas | 0.1 /100 | #273 | Tragic 2.4% |
| Immigrants | Latin America | 0.0 /100 | #274 | Tragic 2.4% |
| Chippewa | 0.0 /100 | #275 | Tragic 2.4% |
| Scotch-Irish | 0.0 /100 | #276 | Tragic 2.4% |
| Bahamians | 0.0 /100 | #277 | Tragic 2.4% |