Northern European vs Immigrants from El Salvador Female Disability
COMPARE
Northern European
Immigrants from El Salvador
Female Disability
Female Disability Comparison
Northern Europeans
Immigrants from El Salvador
12.3%
FEMALE DISABILITY
27.5/ 100
METRIC RATING
193rd/ 347
METRIC RANK
11.4%
FEMALE DISABILITY
99.9/ 100
METRIC RATING
64th/ 347
METRIC RANK
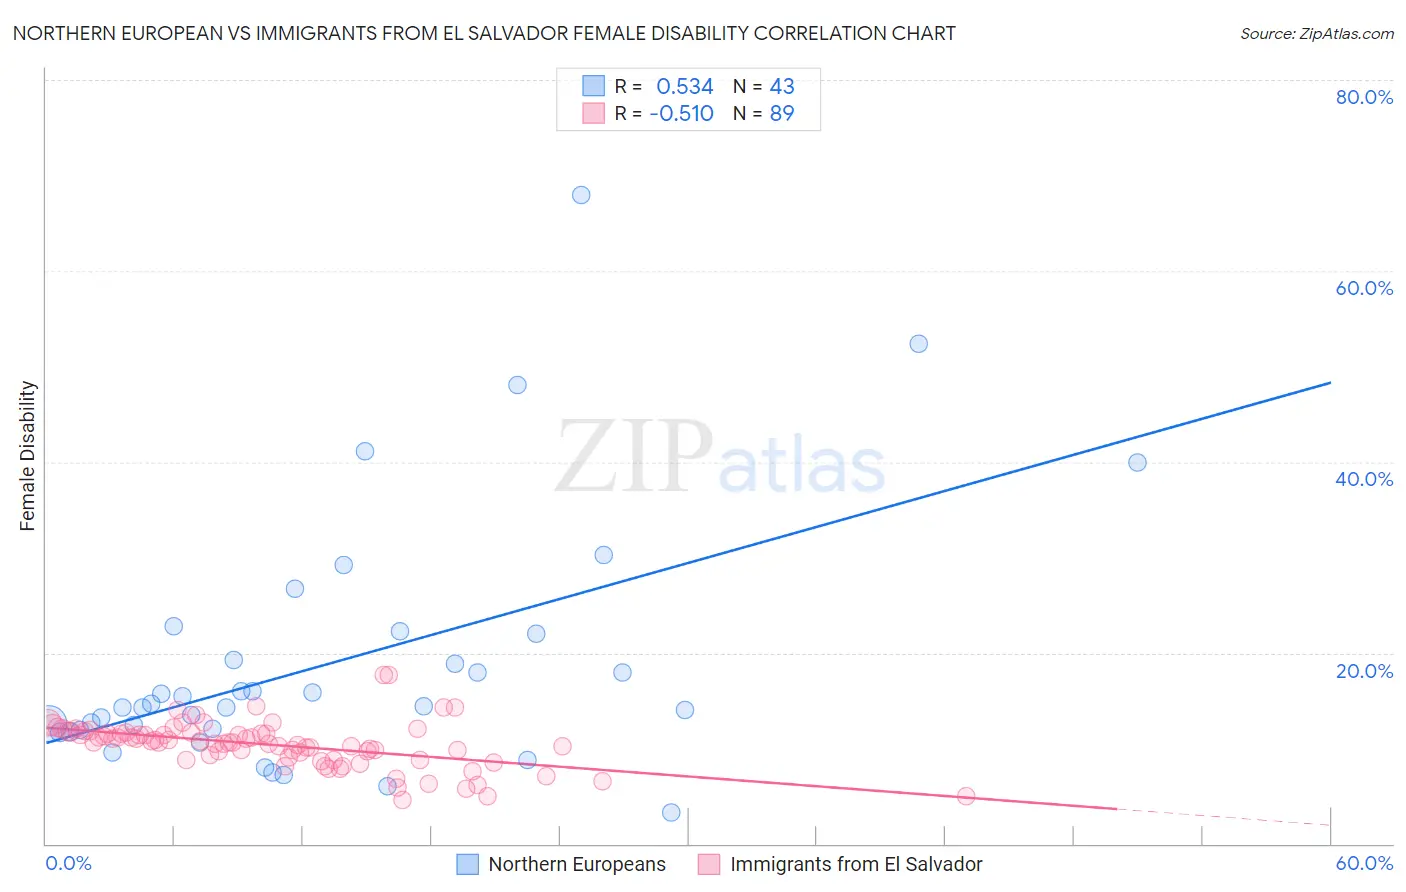
Northern European vs Immigrants from El Salvador Female Disability Correlation Chart
The statistical analysis conducted on geographies consisting of 406,028,817 people shows a substantial positive correlation between the proportion of Northern Europeans and percentage of females with a disability in the United States with a correlation coefficient (R) of 0.534 and weighted average of 12.3%. Similarly, the statistical analysis conducted on geographies consisting of 357,763,756 people shows a substantial negative correlation between the proportion of Immigrants from El Salvador and percentage of females with a disability in the United States with a correlation coefficient (R) of -0.510 and weighted average of 11.4%, a difference of 7.6%.
Female Disability Correlation Summary
| Measurement | Northern European | Immigrants from El Salvador |
| Minimum | 3.3% | 4.5% |
| Maximum | 68.0% | 17.7% |
| Range | 64.7% | 13.2% |
| Mean | 18.9% | 10.4% |
| Median | 14.4% | 10.6% |
| Interquartile 25% (IQ1) | 12.0% | 8.9% |
| Interquartile 75% (IQ3) | 22.0% | 11.6% |
| Interquartile Range (IQR) | 10.0% | 2.7% |
| Standard Deviation (Sample) | 13.1% | 2.4% |
| Standard Deviation (Population) | 13.0% | 2.4% |
Similar Demographics by Female Disability
Demographics Similar to Northern Europeans by Female Disability
In terms of female disability, the demographic groups most similar to Northern Europeans are Ukrainian (12.3%, a difference of 0.010%), Swedish (12.3%, a difference of 0.040%), Immigrants from Western Africa (12.3%, a difference of 0.080%), Armenian (12.3%, a difference of 0.10%), and Immigrants from Panama (12.3%, a difference of 0.10%).
| Demographics | Rating | Rank | Female Disability |
| Austrians | 33.3 /100 | #186 | Fair 12.3% |
| Serbians | 33.1 /100 | #187 | Fair 12.3% |
| Immigrants | North America | 32.8 /100 | #188 | Fair 12.3% |
| Immigrants | Albania | 31.6 /100 | #189 | Fair 12.3% |
| Immigrants | Honduras | 31.3 /100 | #190 | Fair 12.3% |
| Armenians | 29.7 /100 | #191 | Fair 12.3% |
| Immigrants | Western Africa | 29.2 /100 | #192 | Fair 12.3% |
| Northern Europeans | 27.5 /100 | #193 | Fair 12.3% |
| Ukrainians | 27.2 /100 | #194 | Fair 12.3% |
| Swedes | 26.6 /100 | #195 | Fair 12.3% |
| Immigrants | Panama | 25.5 /100 | #196 | Fair 12.3% |
| Hondurans | 25.4 /100 | #197 | Fair 12.3% |
| Mexican American Indians | 24.9 /100 | #198 | Fair 12.3% |
| Immigrants | Trinidad and Tobago | 24.7 /100 | #199 | Fair 12.3% |
| Trinidadians and Tobagonians | 22.4 /100 | #200 | Fair 12.3% |
Demographics Similar to Immigrants from El Salvador by Female Disability
In terms of female disability, the demographic groups most similar to Immigrants from El Salvador are Immigrants from South America (11.4%, a difference of 0.020%), Immigrants from Colombia (11.4%, a difference of 0.070%), Sri Lankan (11.4%, a difference of 0.17%), Salvadoran (11.5%, a difference of 0.19%), and Immigrants from Vietnam (11.5%, a difference of 0.24%).
| Demographics | Rating | Rank | Female Disability |
| South Americans | 99.9 /100 | #57 | Exceptional 11.4% |
| Laotians | 99.9 /100 | #58 | Exceptional 11.4% |
| Immigrants | Spain | 99.9 /100 | #59 | Exceptional 11.4% |
| Immigrants | Bulgaria | 99.9 /100 | #60 | Exceptional 11.4% |
| Immigrants | France | 99.9 /100 | #61 | Exceptional 11.4% |
| Sri Lankans | 99.9 /100 | #62 | Exceptional 11.4% |
| Immigrants | Colombia | 99.9 /100 | #63 | Exceptional 11.4% |
| Immigrants | El Salvador | 99.9 /100 | #64 | Exceptional 11.4% |
| Immigrants | South America | 99.9 /100 | #65 | Exceptional 11.4% |
| Salvadorans | 99.8 /100 | #66 | Exceptional 11.5% |
| Immigrants | Vietnam | 99.8 /100 | #67 | Exceptional 11.5% |
| Immigrants | Northern Africa | 99.8 /100 | #68 | Exceptional 11.5% |
| Colombians | 99.8 /100 | #69 | Exceptional 11.5% |
| Immigrants | Chile | 99.8 /100 | #70 | Exceptional 11.5% |
| Immigrants | Ireland | 99.8 /100 | #71 | Exceptional 11.5% |