Northern European vs Bhutanese Female Disability
COMPARE
Northern European
Bhutanese
Female Disability
Female Disability Comparison
Northern Europeans
Bhutanese
12.3%
FEMALE DISABILITY
27.5/ 100
METRIC RATING
193rd/ 347
METRIC RANK
11.5%
FEMALE DISABILITY
99.8/ 100
METRIC RATING
74th/ 347
METRIC RANK
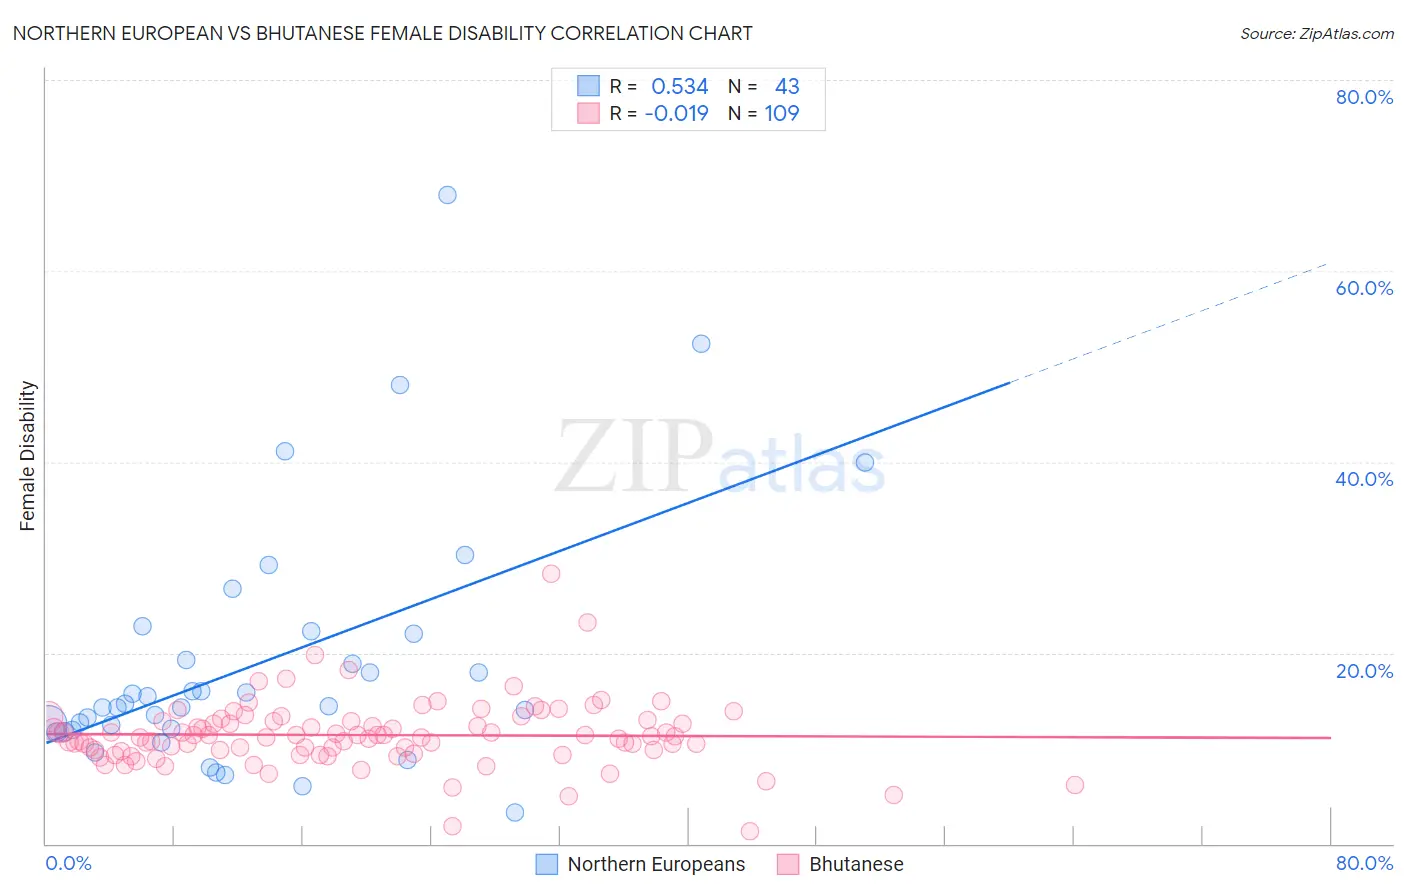
Northern European vs Bhutanese Female Disability Correlation Chart
The statistical analysis conducted on geographies consisting of 406,028,817 people shows a substantial positive correlation between the proportion of Northern Europeans and percentage of females with a disability in the United States with a correlation coefficient (R) of 0.534 and weighted average of 12.3%. Similarly, the statistical analysis conducted on geographies consisting of 455,486,745 people shows no correlation between the proportion of Bhutanese and percentage of females with a disability in the United States with a correlation coefficient (R) of -0.019 and weighted average of 11.5%, a difference of 7.0%.
Female Disability Correlation Summary
| Measurement | Northern European | Bhutanese |
| Minimum | 3.3% | 1.4% |
| Maximum | 68.0% | 28.3% |
| Range | 64.7% | 26.9% |
| Mean | 18.9% | 11.4% |
| Median | 14.4% | 11.2% |
| Interquartile 25% (IQ1) | 12.0% | 9.7% |
| Interquartile 75% (IQ3) | 22.0% | 12.9% |
| Interquartile Range (IQR) | 10.0% | 3.2% |
| Standard Deviation (Sample) | 13.1% | 3.5% |
| Standard Deviation (Population) | 13.0% | 3.5% |
Similar Demographics by Female Disability
Demographics Similar to Northern Europeans by Female Disability
In terms of female disability, the demographic groups most similar to Northern Europeans are Ukrainian (12.3%, a difference of 0.010%), Swedish (12.3%, a difference of 0.040%), Immigrants from Western Africa (12.3%, a difference of 0.080%), Armenian (12.3%, a difference of 0.10%), and Immigrants from Panama (12.3%, a difference of 0.10%).
| Demographics | Rating | Rank | Female Disability |
| Austrians | 33.3 /100 | #186 | Fair 12.3% |
| Serbians | 33.1 /100 | #187 | Fair 12.3% |
| Immigrants | North America | 32.8 /100 | #188 | Fair 12.3% |
| Immigrants | Albania | 31.6 /100 | #189 | Fair 12.3% |
| Immigrants | Honduras | 31.3 /100 | #190 | Fair 12.3% |
| Armenians | 29.7 /100 | #191 | Fair 12.3% |
| Immigrants | Western Africa | 29.2 /100 | #192 | Fair 12.3% |
| Northern Europeans | 27.5 /100 | #193 | Fair 12.3% |
| Ukrainians | 27.2 /100 | #194 | Fair 12.3% |
| Swedes | 26.6 /100 | #195 | Fair 12.3% |
| Immigrants | Panama | 25.5 /100 | #196 | Fair 12.3% |
| Hondurans | 25.4 /100 | #197 | Fair 12.3% |
| Mexican American Indians | 24.9 /100 | #198 | Fair 12.3% |
| Immigrants | Trinidad and Tobago | 24.7 /100 | #199 | Fair 12.3% |
| Trinidadians and Tobagonians | 22.4 /100 | #200 | Fair 12.3% |
Demographics Similar to Bhutanese by Female Disability
In terms of female disability, the demographic groups most similar to Bhutanese are Immigrants from Switzerland (11.5%, a difference of 0.080%), Chilean (11.5%, a difference of 0.090%), Immigrants from Lebanon (11.5%, a difference of 0.12%), Immigrants from Eritrea (11.5%, a difference of 0.15%), and Immigrants from Afghanistan (11.5%, a difference of 0.15%).
| Demographics | Rating | Rank | Female Disability |
| Immigrants | Vietnam | 99.8 /100 | #67 | Exceptional 11.5% |
| Immigrants | Northern Africa | 99.8 /100 | #68 | Exceptional 11.5% |
| Colombians | 99.8 /100 | #69 | Exceptional 11.5% |
| Immigrants | Chile | 99.8 /100 | #70 | Exceptional 11.5% |
| Immigrants | Ireland | 99.8 /100 | #71 | Exceptional 11.5% |
| Chileans | 99.8 /100 | #72 | Exceptional 11.5% |
| Immigrants | Switzerland | 99.8 /100 | #73 | Exceptional 11.5% |
| Bhutanese | 99.8 /100 | #74 | Exceptional 11.5% |
| Immigrants | Lebanon | 99.7 /100 | #75 | Exceptional 11.5% |
| Immigrants | Eritrea | 99.7 /100 | #76 | Exceptional 11.5% |
| Immigrants | Afghanistan | 99.7 /100 | #77 | Exceptional 11.5% |
| Immigrants | South Africa | 99.7 /100 | #78 | Exceptional 11.5% |
| Sierra Leoneans | 99.7 /100 | #79 | Exceptional 11.5% |
| Immigrants | Jordan | 99.7 /100 | #80 | Exceptional 11.5% |
| Eastern Europeans | 99.7 /100 | #81 | Exceptional 11.5% |