Immigrants from Thailand vs Czechoslovakian Disability Age 5 to 17
COMPARE
Immigrants from Thailand
Czechoslovakian
Disability Age 5 to 17
Disability Age 5 to 17 Comparison
Immigrants from Thailand
Czechoslovakians
5.7%
DISABILITY AGE 5 TO 17
30.2/ 100
METRIC RATING
187th/ 347
METRIC RANK
5.9%
DISABILITY AGE 5 TO 17
0.7/ 100
METRIC RATING
263rd/ 347
METRIC RANK
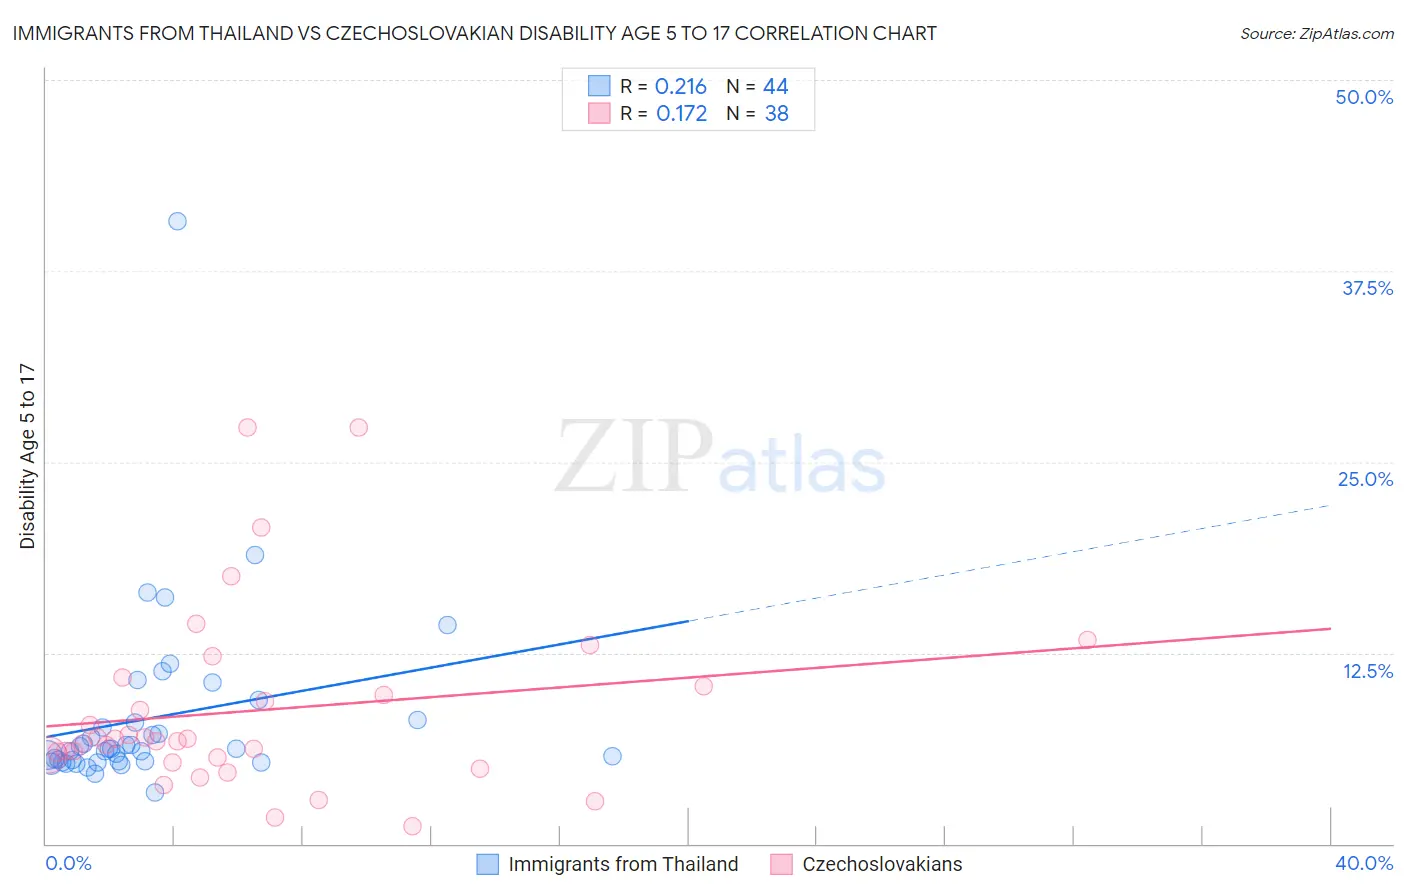
Immigrants from Thailand vs Czechoslovakian Disability Age 5 to 17 Correlation Chart
The statistical analysis conducted on geographies consisting of 315,092,447 people shows a weak positive correlation between the proportion of Immigrants from Thailand and percentage of population with a disability between the ages 5 and 17 in the United States with a correlation coefficient (R) of 0.216 and weighted average of 5.7%. Similarly, the statistical analysis conducted on geographies consisting of 365,368,249 people shows a poor positive correlation between the proportion of Czechoslovakians and percentage of population with a disability between the ages 5 and 17 in the United States with a correlation coefficient (R) of 0.172 and weighted average of 5.9%, a difference of 5.1%.
Disability Age 5 to 17 Correlation Summary
| Measurement | Immigrants from Thailand | Czechoslovakian |
| Minimum | 3.4% | 1.1% |
| Maximum | 40.7% | 27.3% |
| Range | 37.4% | 26.2% |
| Mean | 8.2% | 8.7% |
| Median | 6.2% | 6.8% |
| Interquartile 25% (IQ1) | 5.4% | 5.6% |
| Interquartile 75% (IQ3) | 8.0% | 10.3% |
| Interquartile Range (IQR) | 2.6% | 4.7% |
| Standard Deviation (Sample) | 6.1% | 6.0% |
| Standard Deviation (Population) | 6.0% | 5.9% |
Similar Demographics by Disability Age 5 to 17
Demographics Similar to Immigrants from Thailand by Disability Age 5 to 17
In terms of disability age 5 to 17, the demographic groups most similar to Immigrants from Thailand are Fijian (5.7%, a difference of 0.090%), Marshallese (5.7%, a difference of 0.12%), Pueblo (5.7%, a difference of 0.16%), Immigrants from Eastern Africa (5.7%, a difference of 0.17%), and Syrian (5.6%, a difference of 0.20%).
| Demographics | Rating | Rank | Disability Age 5 to 17 |
| Immigrants | Uruguay | 37.7 /100 | #180 | Fair 5.6% |
| Immigrants | England | 36.4 /100 | #181 | Fair 5.6% |
| Mexican American Indians | 35.2 /100 | #182 | Fair 5.6% |
| Immigrants | Latin America | 34.3 /100 | #183 | Fair 5.6% |
| Syrians | 33.8 /100 | #184 | Fair 5.6% |
| Immigrants | Mexico | 33.7 /100 | #185 | Fair 5.6% |
| Fijians | 31.7 /100 | #186 | Fair 5.7% |
| Immigrants | Thailand | 30.2 /100 | #187 | Fair 5.7% |
| Marshallese | 28.1 /100 | #188 | Fair 5.7% |
| Pueblo | 27.5 /100 | #189 | Fair 5.7% |
| Immigrants | Eastern Africa | 27.3 /100 | #190 | Fair 5.7% |
| Danes | 26.5 /100 | #191 | Fair 5.7% |
| Immigrants | Bosnia and Herzegovina | 26.3 /100 | #192 | Fair 5.7% |
| Immigrants | Canada | 26.1 /100 | #193 | Fair 5.7% |
| Croatians | 23.6 /100 | #194 | Fair 5.7% |
Demographics Similar to Czechoslovakians by Disability Age 5 to 17
In terms of disability age 5 to 17, the demographic groups most similar to Czechoslovakians are Immigrants from Western Africa (5.9%, a difference of 0.080%), Immigrants from Middle Africa (5.9%, a difference of 0.11%), Canadian (6.0%, a difference of 0.12%), Somali (5.9%, a difference of 0.18%), and Panamanian (6.0%, a difference of 0.19%).
| Demographics | Rating | Rank | Disability Age 5 to 17 |
| Hopi | 1.0 /100 | #256 | Tragic 5.9% |
| Hispanics or Latinos | 1.0 /100 | #257 | Tragic 5.9% |
| Brazilians | 0.9 /100 | #258 | Tragic 5.9% |
| Slavs | 0.9 /100 | #259 | Tragic 5.9% |
| Somalis | 0.8 /100 | #260 | Tragic 5.9% |
| Immigrants | Middle Africa | 0.7 /100 | #261 | Tragic 5.9% |
| Immigrants | Western Africa | 0.7 /100 | #262 | Tragic 5.9% |
| Czechoslovakians | 0.7 /100 | #263 | Tragic 5.9% |
| Canadians | 0.6 /100 | #264 | Tragic 6.0% |
| Panamanians | 0.6 /100 | #265 | Tragic 6.0% |
| Slovenes | 0.6 /100 | #266 | Tragic 6.0% |
| Spanish | 0.5 /100 | #267 | Tragic 6.0% |
| Sioux | 0.4 /100 | #268 | Tragic 6.0% |
| Liberians | 0.4 /100 | #269 | Tragic 6.0% |
| Immigrants | Somalia | 0.4 /100 | #270 | Tragic 6.0% |