Lithuanian vs Celtic Ambulatory Disability
COMPARE
Lithuanian
Celtic
Ambulatory Disability
Ambulatory Disability Comparison
Lithuanians
Celtics
6.0%
AMBULATORY DISABILITY
81.9/ 100
METRIC RATING
149th/ 347
METRIC RANK
6.7%
AMBULATORY DISABILITY
0.1/ 100
METRIC RATING
276th/ 347
METRIC RANK
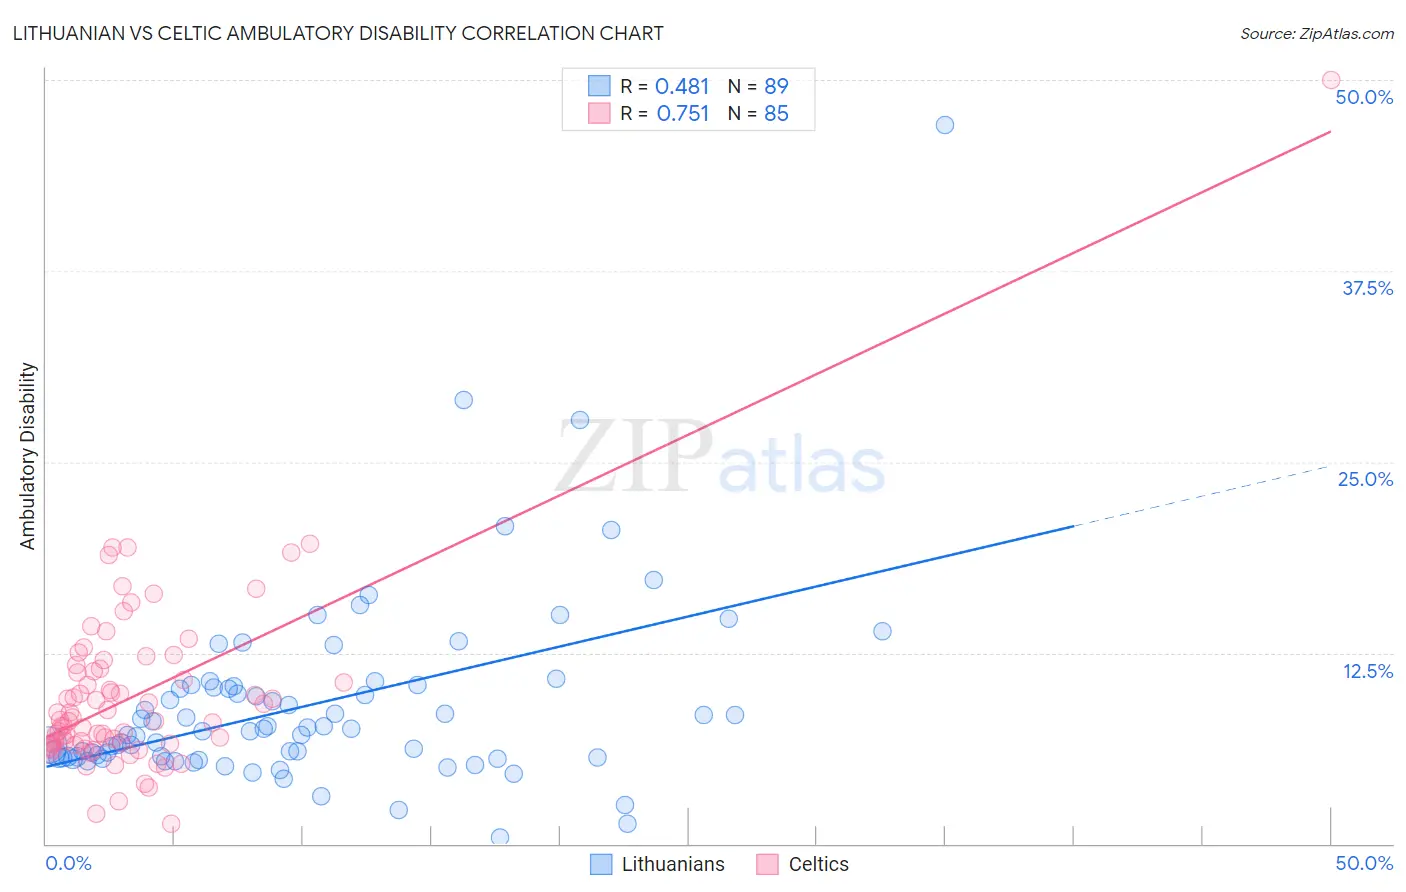
Lithuanian vs Celtic Ambulatory Disability Correlation Chart
The statistical analysis conducted on geographies consisting of 421,829,236 people shows a moderate positive correlation between the proportion of Lithuanians and percentage of population with ambulatory disability in the United States with a correlation coefficient (R) of 0.481 and weighted average of 6.0%. Similarly, the statistical analysis conducted on geographies consisting of 168,862,473 people shows a strong positive correlation between the proportion of Celtics and percentage of population with ambulatory disability in the United States with a correlation coefficient (R) of 0.751 and weighted average of 6.7%, a difference of 12.0%.
Ambulatory Disability Correlation Summary
| Measurement | Lithuanian | Celtic |
| Minimum | 0.40% | 1.3% |
| Maximum | 47.1% | 50.0% |
| Range | 46.7% | 48.7% |
| Mean | 9.0% | 9.7% |
| Median | 7.4% | 8.0% |
| Interquartile 25% (IQ1) | 5.7% | 6.5% |
| Interquartile 75% (IQ3) | 10.3% | 11.4% |
| Interquartile Range (IQR) | 4.6% | 4.8% |
| Standard Deviation (Sample) | 6.3% | 6.0% |
| Standard Deviation (Population) | 6.3% | 6.0% |
Similar Demographics by Ambulatory Disability
Demographics Similar to Lithuanians by Ambulatory Disability
In terms of ambulatory disability, the demographic groups most similar to Lithuanians are Immigrants from Eastern Europe (6.0%, a difference of 0.010%), Maltese (6.0%, a difference of 0.020%), Immigrants from Moldova (6.0%, a difference of 0.050%), Pakistani (6.0%, a difference of 0.060%), and Immigrants from Greece (6.0%, a difference of 0.060%).
| Demographics | Rating | Rank | Ambulatory Disability |
| Immigrants | Philippines | 83.0 /100 | #142 | Excellent 6.0% |
| Romanians | 82.9 /100 | #143 | Excellent 6.0% |
| Macedonians | 82.8 /100 | #144 | Excellent 6.0% |
| Pakistanis | 82.5 /100 | #145 | Excellent 6.0% |
| Immigrants | Greece | 82.5 /100 | #146 | Excellent 6.0% |
| Immigrants | Moldova | 82.4 /100 | #147 | Excellent 6.0% |
| Immigrants | Eastern Europe | 82.0 /100 | #148 | Excellent 6.0% |
| Lithuanians | 81.9 /100 | #149 | Excellent 6.0% |
| Maltese | 81.6 /100 | #150 | Excellent 6.0% |
| Greeks | 79.6 /100 | #151 | Good 6.0% |
| Immigrants | Austria | 78.8 /100 | #152 | Good 6.0% |
| Syrians | 75.5 /100 | #153 | Good 6.0% |
| Immigrants | Croatia | 75.1 /100 | #154 | Good 6.0% |
| Immigrants | Scotland | 72.1 /100 | #155 | Good 6.0% |
| Northern Europeans | 71.8 /100 | #156 | Good 6.0% |
Demographics Similar to Celtics by Ambulatory Disability
In terms of ambulatory disability, the demographic groups most similar to Celtics are Immigrants from Guyana (6.7%, a difference of 0.030%), Jamaican (6.7%, a difference of 0.080%), Sioux (6.7%, a difference of 0.090%), Immigrants from West Indies (6.7%, a difference of 0.15%), and White/Caucasian (6.7%, a difference of 0.34%).
| Demographics | Rating | Rank | Ambulatory Disability |
| French | 0.1 /100 | #269 | Tragic 6.6% |
| Slovaks | 0.1 /100 | #270 | Tragic 6.7% |
| Immigrants | Trinidad and Tobago | 0.1 /100 | #271 | Tragic 6.7% |
| French Canadians | 0.1 /100 | #272 | Tragic 6.7% |
| Whites/Caucasians | 0.1 /100 | #273 | Tragic 6.7% |
| Sioux | 0.1 /100 | #274 | Tragic 6.7% |
| Immigrants | Guyana | 0.1 /100 | #275 | Tragic 6.7% |
| Celtics | 0.1 /100 | #276 | Tragic 6.7% |
| Jamaicans | 0.1 /100 | #277 | Tragic 6.7% |
| Immigrants | West Indies | 0.1 /100 | #278 | Tragic 6.7% |
| Immigrants | Caribbean | 0.0 /100 | #279 | Tragic 6.7% |
| Pennsylvania Germans | 0.0 /100 | #280 | Tragic 6.8% |
| Yaqui | 0.0 /100 | #281 | Tragic 6.8% |
| Barbadians | 0.0 /100 | #282 | Tragic 6.8% |
| Immigrants | Barbados | 0.0 /100 | #283 | Tragic 6.8% |