Indonesian vs Celtic Ambulatory Disability
COMPARE
Indonesian
Celtic
Ambulatory Disability
Ambulatory Disability Comparison
Indonesians
Celtics
6.3%
AMBULATORY DISABILITY
9.9/ 100
METRIC RATING
219th/ 347
METRIC RANK
6.7%
AMBULATORY DISABILITY
0.1/ 100
METRIC RATING
276th/ 347
METRIC RANK
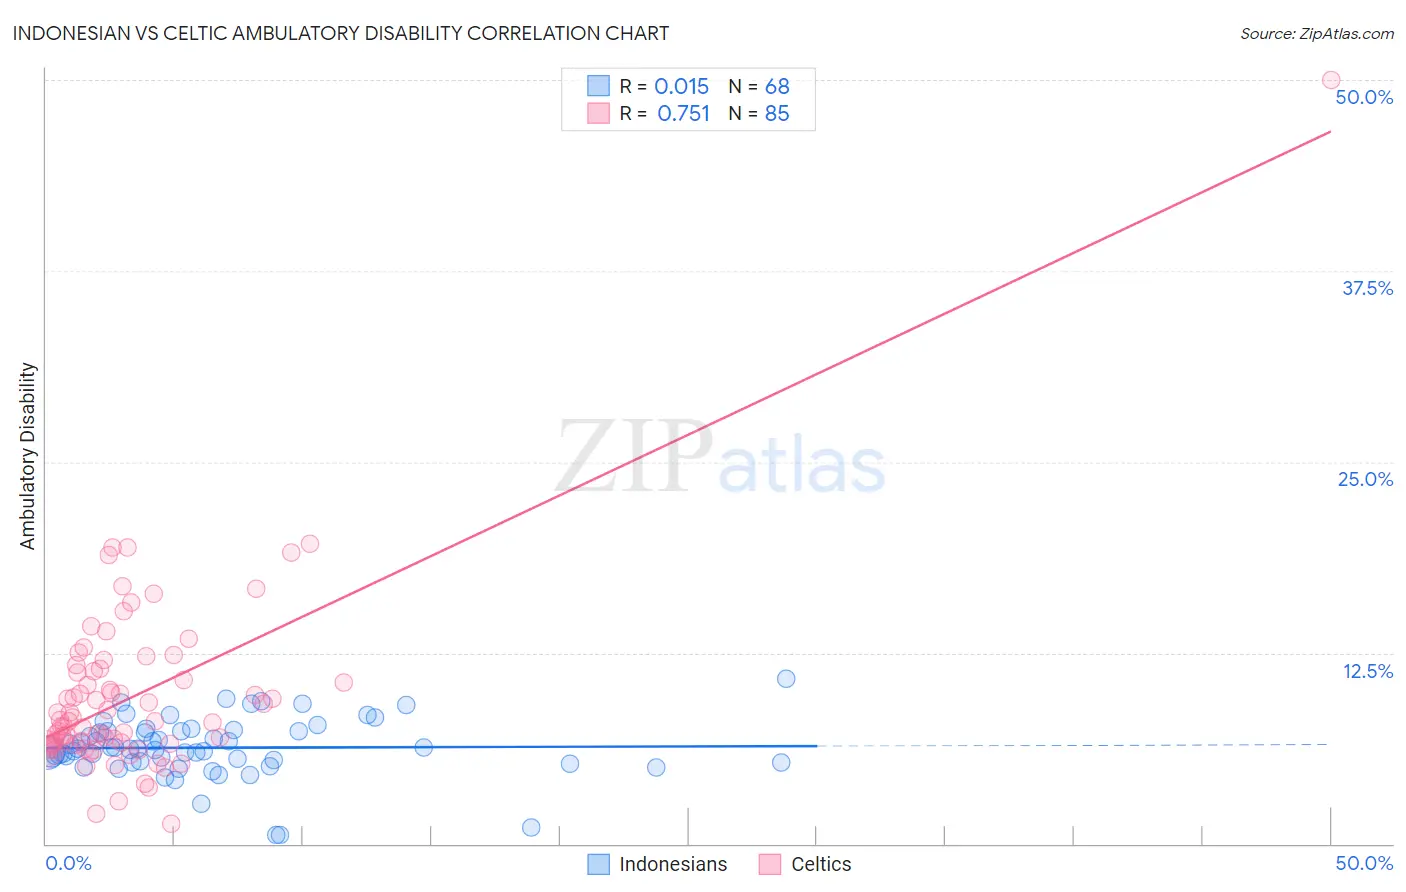
Indonesian vs Celtic Ambulatory Disability Correlation Chart
The statistical analysis conducted on geographies consisting of 162,682,177 people shows no correlation between the proportion of Indonesians and percentage of population with ambulatory disability in the United States with a correlation coefficient (R) of 0.015 and weighted average of 6.3%. Similarly, the statistical analysis conducted on geographies consisting of 168,862,473 people shows a strong positive correlation between the proportion of Celtics and percentage of population with ambulatory disability in the United States with a correlation coefficient (R) of 0.751 and weighted average of 6.7%, a difference of 6.6%.
Ambulatory Disability Correlation Summary
| Measurement | Indonesian | Celtic |
| Minimum | 0.59% | 1.3% |
| Maximum | 10.8% | 50.0% |
| Range | 10.2% | 48.7% |
| Mean | 6.3% | 9.7% |
| Median | 6.2% | 8.0% |
| Interquartile 25% (IQ1) | 5.3% | 6.5% |
| Interquartile 75% (IQ3) | 7.4% | 11.4% |
| Interquartile Range (IQR) | 2.1% | 4.8% |
| Standard Deviation (Sample) | 1.9% | 6.0% |
| Standard Deviation (Population) | 1.9% | 6.0% |
Similar Demographics by Ambulatory Disability
Demographics Similar to Indonesians by Ambulatory Disability
In terms of ambulatory disability, the demographic groups most similar to Indonesians are Immigrants from Albania (6.3%, a difference of 0.040%), Hungarian (6.3%, a difference of 0.050%), German Russian (6.3%, a difference of 0.070%), Guamanian/Chamorro (6.3%, a difference of 0.10%), and Canadian (6.3%, a difference of 0.14%).
| Demographics | Rating | Rank | Ambulatory Disability |
| Mexican American Indians | 12.0 /100 | #212 | Poor 6.3% |
| Japanese | 12.0 /100 | #213 | Poor 6.3% |
| Immigrants | Mexico | 11.0 /100 | #214 | Poor 6.3% |
| Immigrants | Latin America | 11.0 /100 | #215 | Poor 6.3% |
| Canadians | 10.9 /100 | #216 | Poor 6.3% |
| Yugoslavians | 10.9 /100 | #217 | Poor 6.3% |
| Guamanians/Chamorros | 10.6 /100 | #218 | Poor 6.3% |
| Indonesians | 9.9 /100 | #219 | Tragic 6.3% |
| Immigrants | Albania | 9.6 /100 | #220 | Tragic 6.3% |
| Hungarians | 9.6 /100 | #221 | Tragic 6.3% |
| German Russians | 9.4 /100 | #222 | Tragic 6.3% |
| Immigrants | Honduras | 7.6 /100 | #223 | Tragic 6.3% |
| Liberians | 7.1 /100 | #224 | Tragic 6.3% |
| Hondurans | 6.3 /100 | #225 | Tragic 6.3% |
| Slavs | 5.1 /100 | #226 | Tragic 6.4% |
Demographics Similar to Celtics by Ambulatory Disability
In terms of ambulatory disability, the demographic groups most similar to Celtics are Immigrants from Guyana (6.7%, a difference of 0.030%), Jamaican (6.7%, a difference of 0.080%), Sioux (6.7%, a difference of 0.090%), Immigrants from West Indies (6.7%, a difference of 0.15%), and White/Caucasian (6.7%, a difference of 0.34%).
| Demographics | Rating | Rank | Ambulatory Disability |
| French | 0.1 /100 | #269 | Tragic 6.6% |
| Slovaks | 0.1 /100 | #270 | Tragic 6.7% |
| Immigrants | Trinidad and Tobago | 0.1 /100 | #271 | Tragic 6.7% |
| French Canadians | 0.1 /100 | #272 | Tragic 6.7% |
| Whites/Caucasians | 0.1 /100 | #273 | Tragic 6.7% |
| Sioux | 0.1 /100 | #274 | Tragic 6.7% |
| Immigrants | Guyana | 0.1 /100 | #275 | Tragic 6.7% |
| Celtics | 0.1 /100 | #276 | Tragic 6.7% |
| Jamaicans | 0.1 /100 | #277 | Tragic 6.7% |
| Immigrants | West Indies | 0.1 /100 | #278 | Tragic 6.7% |
| Immigrants | Caribbean | 0.0 /100 | #279 | Tragic 6.7% |
| Pennsylvania Germans | 0.0 /100 | #280 | Tragic 6.8% |
| Yaqui | 0.0 /100 | #281 | Tragic 6.8% |
| Barbadians | 0.0 /100 | #282 | Tragic 6.8% |
| Immigrants | Barbados | 0.0 /100 | #283 | Tragic 6.8% |