Nigerian vs Immigrants from Eritrea Female Disability
COMPARE
Nigerian
Immigrants from Eritrea
Female Disability
Female Disability Comparison
Nigerians
Immigrants from Eritrea
12.0%
FEMALE DISABILITY
84.0/ 100
METRIC RATING
147th/ 347
METRIC RANK
11.5%
FEMALE DISABILITY
99.7/ 100
METRIC RATING
76th/ 347
METRIC RANK
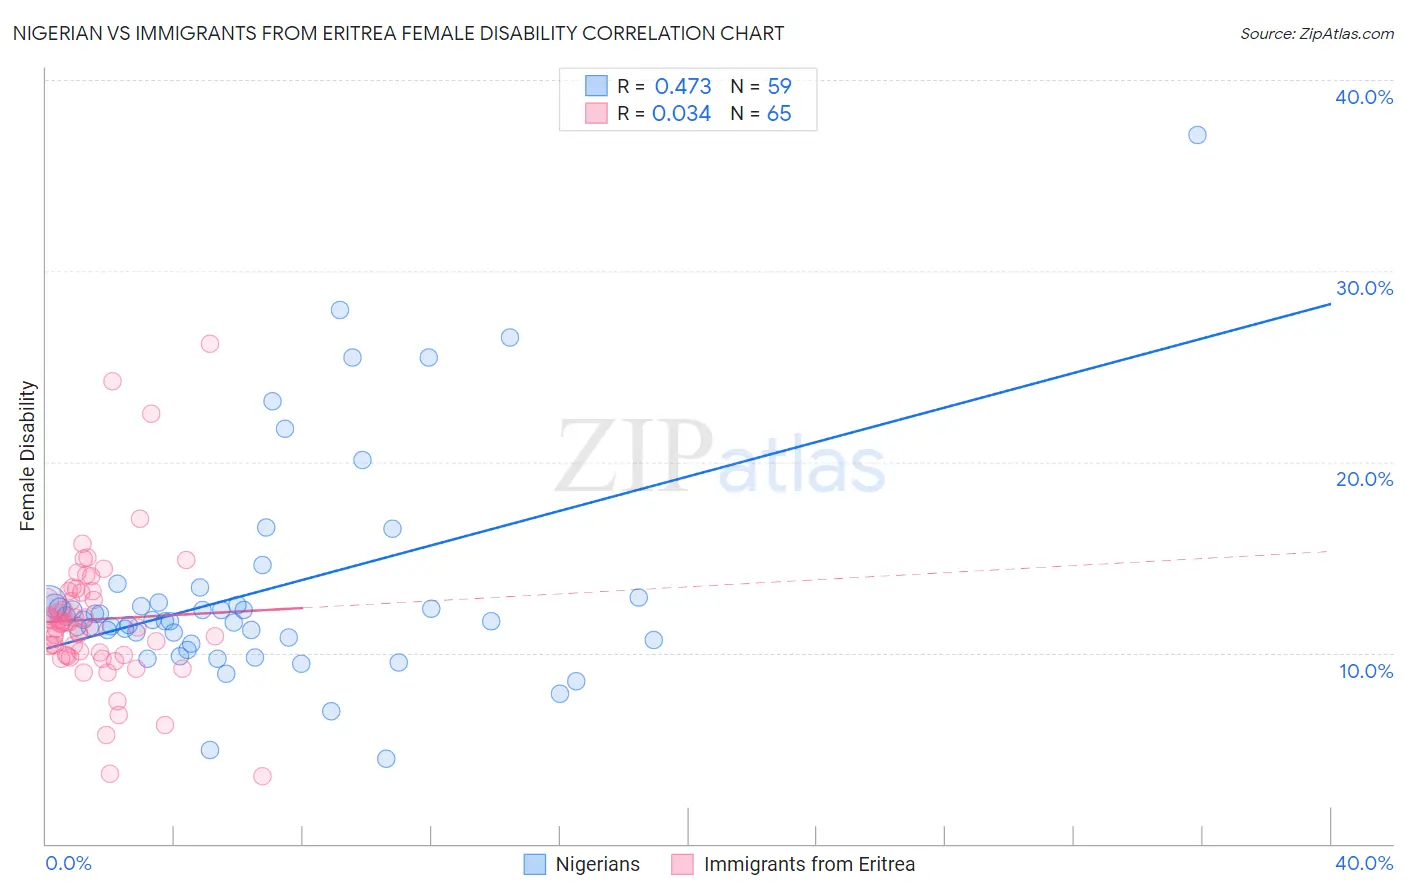
Nigerian vs Immigrants from Eritrea Female Disability Correlation Chart
The statistical analysis conducted on geographies consisting of 332,726,873 people shows a moderate positive correlation between the proportion of Nigerians and percentage of females with a disability in the United States with a correlation coefficient (R) of 0.473 and weighted average of 12.0%. Similarly, the statistical analysis conducted on geographies consisting of 104,854,458 people shows no correlation between the proportion of Immigrants from Eritrea and percentage of females with a disability in the United States with a correlation coefficient (R) of 0.034 and weighted average of 11.5%, a difference of 4.2%.
Female Disability Correlation Summary
| Measurement | Nigerian | Immigrants from Eritrea |
| Minimum | 4.4% | 3.5% |
| Maximum | 37.1% | 26.2% |
| Range | 32.7% | 22.7% |
| Mean | 13.2% | 11.7% |
| Median | 11.7% | 11.5% |
| Interquartile 25% (IQ1) | 10.6% | 9.9% |
| Interquartile 75% (IQ3) | 12.7% | 13.2% |
| Interquartile Range (IQR) | 2.0% | 3.3% |
| Standard Deviation (Sample) | 5.8% | 3.8% |
| Standard Deviation (Population) | 5.7% | 3.7% |
Similar Demographics by Female Disability
Demographics Similar to Nigerians by Female Disability
In terms of female disability, the demographic groups most similar to Nigerians are Pakistani (12.0%, a difference of 0.040%), Immigrants from Kenya (12.0%, a difference of 0.070%), Greek (12.0%, a difference of 0.14%), Immigrants from Moldova (12.0%, a difference of 0.18%), and Icelander (12.0%, a difference of 0.22%).
| Demographics | Rating | Rank | Female Disability |
| Romanians | 91.6 /100 | #140 | Exceptional 11.9% |
| Immigrants | Ecuador | 91.5 /100 | #141 | Exceptional 11.9% |
| Immigrants | Africa | 90.0 /100 | #142 | Excellent 11.9% |
| Immigrants | Sudan | 89.6 /100 | #143 | Excellent 11.9% |
| Immigrants | Austria | 87.9 /100 | #144 | Excellent 12.0% |
| Estonians | 87.8 /100 | #145 | Excellent 12.0% |
| Pakistanis | 84.6 /100 | #146 | Excellent 12.0% |
| Nigerians | 84.0 /100 | #147 | Excellent 12.0% |
| Immigrants | Kenya | 83.1 /100 | #148 | Excellent 12.0% |
| Greeks | 82.0 /100 | #149 | Excellent 12.0% |
| Immigrants | Moldova | 81.4 /100 | #150 | Excellent 12.0% |
| Icelanders | 80.7 /100 | #151 | Excellent 12.0% |
| Immigrants | Scotland | 79.3 /100 | #152 | Good 12.0% |
| Sudanese | 79.1 /100 | #153 | Good 12.0% |
| Syrians | 76.9 /100 | #154 | Good 12.1% |
Demographics Similar to Immigrants from Eritrea by Female Disability
In terms of female disability, the demographic groups most similar to Immigrants from Eritrea are Immigrants from Afghanistan (11.5%, a difference of 0.0%), Immigrants from South Africa (11.5%, a difference of 0.010%), Immigrants from Lebanon (11.5%, a difference of 0.030%), Sierra Leonean (11.5%, a difference of 0.030%), and Immigrants from Jordan (11.5%, a difference of 0.040%).
| Demographics | Rating | Rank | Female Disability |
| Colombians | 99.8 /100 | #69 | Exceptional 11.5% |
| Immigrants | Chile | 99.8 /100 | #70 | Exceptional 11.5% |
| Immigrants | Ireland | 99.8 /100 | #71 | Exceptional 11.5% |
| Chileans | 99.8 /100 | #72 | Exceptional 11.5% |
| Immigrants | Switzerland | 99.8 /100 | #73 | Exceptional 11.5% |
| Bhutanese | 99.8 /100 | #74 | Exceptional 11.5% |
| Immigrants | Lebanon | 99.7 /100 | #75 | Exceptional 11.5% |
| Immigrants | Eritrea | 99.7 /100 | #76 | Exceptional 11.5% |
| Immigrants | Afghanistan | 99.7 /100 | #77 | Exceptional 11.5% |
| Immigrants | South Africa | 99.7 /100 | #78 | Exceptional 11.5% |
| Sierra Leoneans | 99.7 /100 | #79 | Exceptional 11.5% |
| Immigrants | Jordan | 99.7 /100 | #80 | Exceptional 11.5% |
| Eastern Europeans | 99.7 /100 | #81 | Exceptional 11.5% |
| Luxembourgers | 99.6 /100 | #82 | Exceptional 11.6% |
| Immigrants | Serbia | 99.6 /100 | #83 | Exceptional 11.6% |