Nigerian vs Colville Cognitive Disability
COMPARE
Nigerian
Colville
Cognitive Disability
Cognitive Disability Comparison
Nigerians
Colville
18.1%
COGNITIVE DISABILITY
0.1/ 100
METRIC RATING
283rd/ 347
METRIC RANK
18.3%
COGNITIVE DISABILITY
0.0/ 100
METRIC RATING
305th/ 347
METRIC RANK
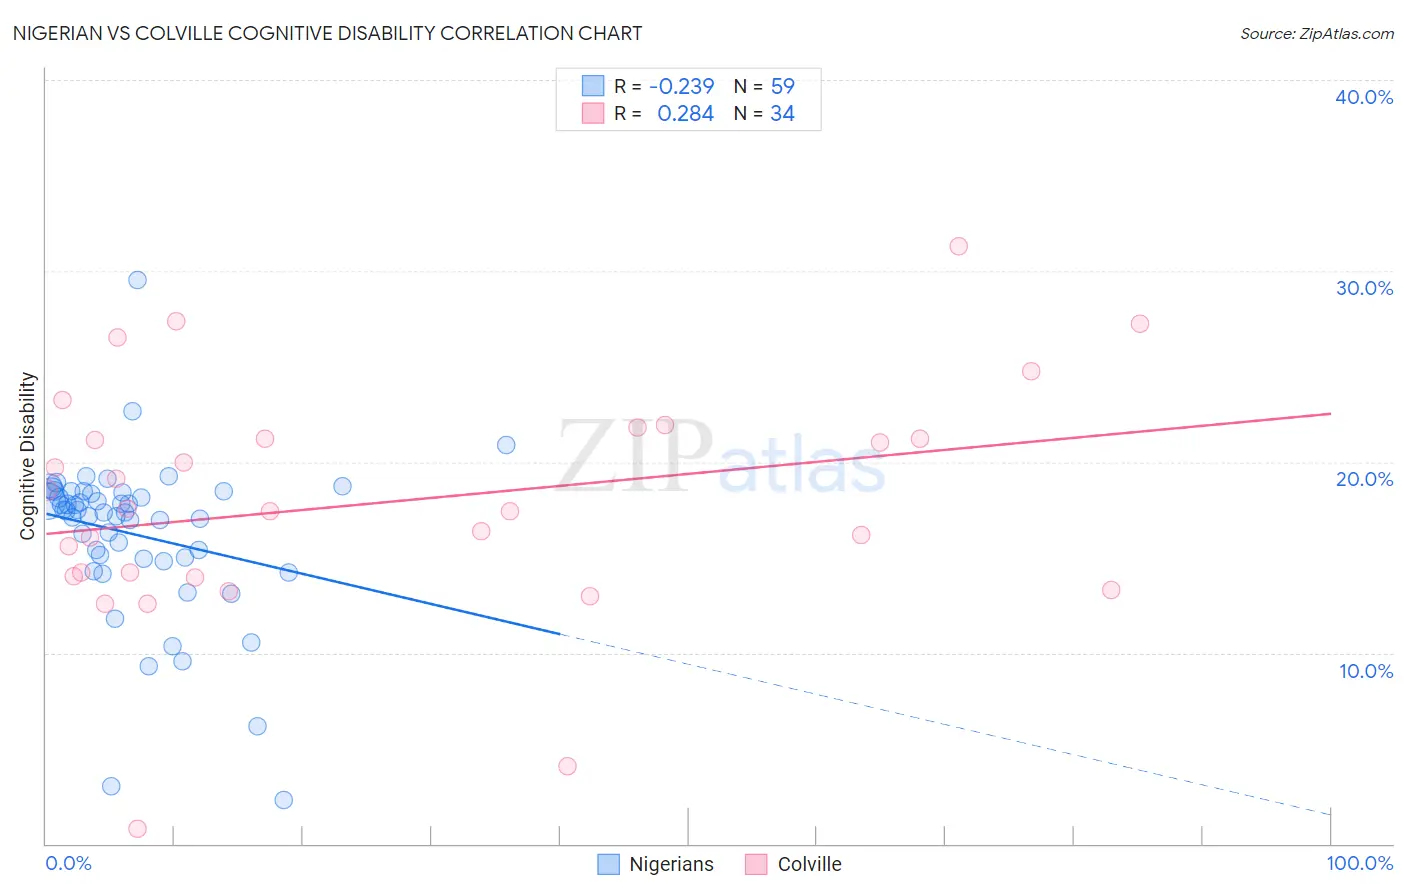
Nigerian vs Colville Cognitive Disability Correlation Chart
The statistical analysis conducted on geographies consisting of 332,733,187 people shows a weak negative correlation between the proportion of Nigerians and percentage of population with cognitive disability in the United States with a correlation coefficient (R) of -0.239 and weighted average of 18.1%. Similarly, the statistical analysis conducted on geographies consisting of 34,687,480 people shows a weak positive correlation between the proportion of Colville and percentage of population with cognitive disability in the United States with a correlation coefficient (R) of 0.284 and weighted average of 18.3%, a difference of 1.3%.
Cognitive Disability Correlation Summary
| Measurement | Nigerian | Colville |
| Minimum | 2.3% | 0.79% |
| Maximum | 29.5% | 31.3% |
| Range | 27.2% | 30.5% |
| Mean | 16.2% | 17.9% |
| Median | 17.4% | 17.5% |
| Interquartile 25% (IQ1) | 14.9% | 14.0% |
| Interquartile 75% (IQ3) | 18.4% | 21.2% |
| Interquartile Range (IQR) | 3.5% | 7.2% |
| Standard Deviation (Sample) | 4.2% | 6.2% |
| Standard Deviation (Population) | 4.2% | 6.1% |
Similar Demographics by Cognitive Disability
Demographics Similar to Nigerians by Cognitive Disability
In terms of cognitive disability, the demographic groups most similar to Nigerians are Immigrants from Cambodia (18.1%, a difference of 0.020%), Immigrants from Uganda (18.1%, a difference of 0.040%), Yakama (18.1%, a difference of 0.050%), Bermudan (18.1%, a difference of 0.050%), and Kenyan (18.1%, a difference of 0.090%).
| Demographics | Rating | Rank | Cognitive Disability |
| Yuman | 0.2 /100 | #276 | Tragic 18.1% |
| Immigrants | Kuwait | 0.2 /100 | #277 | Tragic 18.1% |
| Immigrants | Micronesia | 0.2 /100 | #278 | Tragic 18.1% |
| Chippewa | 0.1 /100 | #279 | Tragic 18.1% |
| West Indians | 0.1 /100 | #280 | Tragic 18.1% |
| Yakama | 0.1 /100 | #281 | Tragic 18.1% |
| Immigrants | Cambodia | 0.1 /100 | #282 | Tragic 18.1% |
| Nigerians | 0.1 /100 | #283 | Tragic 18.1% |
| Immigrants | Uganda | 0.1 /100 | #284 | Tragic 18.1% |
| Bermudans | 0.1 /100 | #285 | Tragic 18.1% |
| Kenyans | 0.1 /100 | #286 | Tragic 18.1% |
| Dutch West Indians | 0.1 /100 | #287 | Tragic 18.1% |
| Immigrants | West Indies | 0.1 /100 | #288 | Tragic 18.1% |
| Natives/Alaskans | 0.1 /100 | #289 | Tragic 18.1% |
| Immigrants | Africa | 0.1 /100 | #290 | Tragic 18.1% |
Demographics Similar to Colville by Cognitive Disability
In terms of cognitive disability, the demographic groups most similar to Colville are Seminole (18.3%, a difference of 0.010%), Ugandan (18.3%, a difference of 0.010%), Immigrants from Western Africa (18.4%, a difference of 0.10%), Immigrants from Eritrea (18.3%, a difference of 0.12%), and Immigrants from Eastern Africa (18.4%, a difference of 0.14%).
| Demographics | Rating | Rank | Cognitive Disability |
| Japanese | 0.0 /100 | #298 | Tragic 18.3% |
| Ghanaians | 0.0 /100 | #299 | Tragic 18.3% |
| Creek | 0.0 /100 | #300 | Tragic 18.3% |
| Immigrants | Ghana | 0.0 /100 | #301 | Tragic 18.3% |
| Barbadians | 0.0 /100 | #302 | Tragic 18.3% |
| Immigrants | Kenya | 0.0 /100 | #303 | Tragic 18.3% |
| Immigrants | Eritrea | 0.0 /100 | #304 | Tragic 18.3% |
| Colville | 0.0 /100 | #305 | Tragic 18.3% |
| Seminole | 0.0 /100 | #306 | Tragic 18.3% |
| Ugandans | 0.0 /100 | #307 | Tragic 18.3% |
| Immigrants | Western Africa | 0.0 /100 | #308 | Tragic 18.4% |
| Immigrants | Eastern Africa | 0.0 /100 | #309 | Tragic 18.4% |
| Choctaw | 0.0 /100 | #310 | Tragic 18.4% |
| Hmong | 0.0 /100 | #311 | Tragic 18.4% |
| Chickasaw | 0.0 /100 | #312 | Tragic 18.5% |