Nigerian vs Colville 7th Grade
COMPARE
Nigerian
Colville
7th Grade
7th Grade Comparison
Nigerians
Colville
95.5%
7TH GRADE
3.0/ 100
METRIC RATING
234th/ 347
METRIC RANK
96.4%
7TH GRADE
91.7/ 100
METRIC RATING
132nd/ 347
METRIC RANK
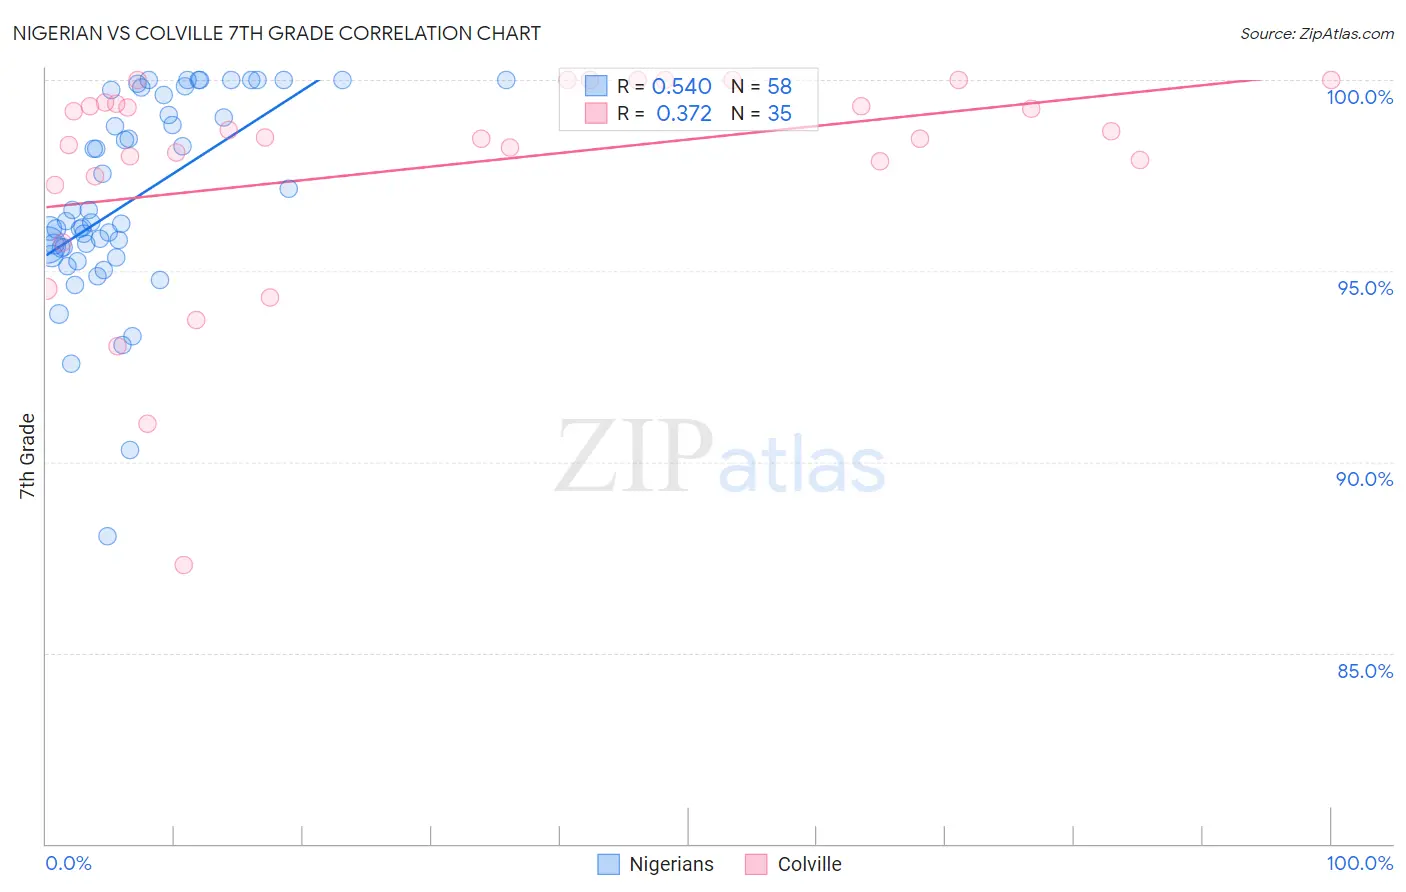
Nigerian vs Colville 7th Grade Correlation Chart
The statistical analysis conducted on geographies consisting of 332,724,627 people shows a substantial positive correlation between the proportion of Nigerians and percentage of population with at least 7th grade education in the United States with a correlation coefficient (R) of 0.540 and weighted average of 95.5%. Similarly, the statistical analysis conducted on geographies consisting of 34,682,094 people shows a mild positive correlation between the proportion of Colville and percentage of population with at least 7th grade education in the United States with a correlation coefficient (R) of 0.372 and weighted average of 96.4%, a difference of 0.91%.
7th Grade Correlation Summary
| Measurement | Nigerian | Colville |
| Minimum | 88.0% | 87.3% |
| Maximum | 100.0% | 100.0% |
| Range | 12.0% | 12.7% |
| Mean | 96.9% | 97.7% |
| Median | 96.3% | 98.5% |
| Interquartile 25% (IQ1) | 95.6% | 97.5% |
| Interquartile 75% (IQ3) | 99.6% | 99.4% |
| Interquartile Range (IQR) | 4.0% | 1.9% |
| Standard Deviation (Sample) | 2.6% | 2.9% |
| Standard Deviation (Population) | 2.6% | 2.8% |
Similar Demographics by 7th Grade
Demographics Similar to Nigerians by 7th Grade
In terms of 7th grade, the demographic groups most similar to Nigerians are Immigrants from Africa (95.5%, a difference of 0.010%), Costa Rican (95.5%, a difference of 0.020%), Immigrants from Indonesia (95.5%, a difference of 0.020%), Asian (95.5%, a difference of 0.020%), and Immigrants from Asia (95.5%, a difference of 0.040%).
| Demographics | Rating | Rank | 7th Grade |
| Immigrants | Western Asia | 5.4 /100 | #227 | Tragic 95.6% |
| Immigrants | Eastern Africa | 5.1 /100 | #228 | Tragic 95.6% |
| Immigrants | Panama | 4.9 /100 | #229 | Tragic 95.6% |
| Natives/Alaskans | 4.2 /100 | #230 | Tragic 95.6% |
| Senegalese | 4.0 /100 | #231 | Tragic 95.6% |
| Costa Ricans | 3.3 /100 | #232 | Tragic 95.5% |
| Immigrants | Indonesia | 3.3 /100 | #233 | Tragic 95.5% |
| Nigerians | 3.0 /100 | #234 | Tragic 95.5% |
| Immigrants | Africa | 2.7 /100 | #235 | Tragic 95.5% |
| Asians | 2.6 /100 | #236 | Tragic 95.5% |
| Immigrants | Asia | 2.3 /100 | #237 | Tragic 95.5% |
| Indians (Asian) | 2.3 /100 | #238 | Tragic 95.5% |
| Jamaicans | 2.2 /100 | #239 | Tragic 95.5% |
| Immigrants | Sierra Leone | 2.0 /100 | #240 | Tragic 95.5% |
| South American Indians | 2.0 /100 | #241 | Tragic 95.5% |
Demographics Similar to Colville by 7th Grade
In terms of 7th grade, the demographic groups most similar to Colville are Filipino (96.4%, a difference of 0.010%), Hmong (96.4%, a difference of 0.010%), Soviet Union (96.4%, a difference of 0.010%), Immigrants from Kuwait (96.4%, a difference of 0.010%), and Immigrants from Serbia (96.4%, a difference of 0.020%).
| Demographics | Rating | Rank | 7th Grade |
| Immigrants | Bulgaria | 94.0 /100 | #125 | Exceptional 96.4% |
| Palestinians | 93.5 /100 | #126 | Exceptional 96.4% |
| Immigrants | Bosnia and Herzegovina | 93.3 /100 | #127 | Exceptional 96.4% |
| Immigrants | Romania | 93.2 /100 | #128 | Exceptional 96.4% |
| Immigrants | North Macedonia | 93.1 /100 | #129 | Exceptional 96.4% |
| Immigrants | Serbia | 92.8 /100 | #130 | Exceptional 96.4% |
| Filipinos | 92.1 /100 | #131 | Exceptional 96.4% |
| Colville | 91.7 /100 | #132 | Exceptional 96.4% |
| Hmong | 91.5 /100 | #133 | Exceptional 96.4% |
| Soviet Union | 91.2 /100 | #134 | Exceptional 96.4% |
| Immigrants | Kuwait | 91.1 /100 | #135 | Exceptional 96.4% |
| Immigrants | Hungary | 90.6 /100 | #136 | Exceptional 96.4% |
| Immigrants | Turkey | 90.2 /100 | #137 | Exceptional 96.4% |
| Jordanians | 90.0 /100 | #138 | Excellent 96.4% |
| Basques | 89.3 /100 | #139 | Excellent 96.4% |