Immigrants from Africa vs Colville Cognitive Disability
COMPARE
Immigrants from Africa
Colville
Cognitive Disability
Cognitive Disability Comparison
Immigrants from Africa
Colville
18.1%
COGNITIVE DISABILITY
0.1/ 100
METRIC RATING
290th/ 347
METRIC RANK
18.3%
COGNITIVE DISABILITY
0.0/ 100
METRIC RATING
305th/ 347
METRIC RANK
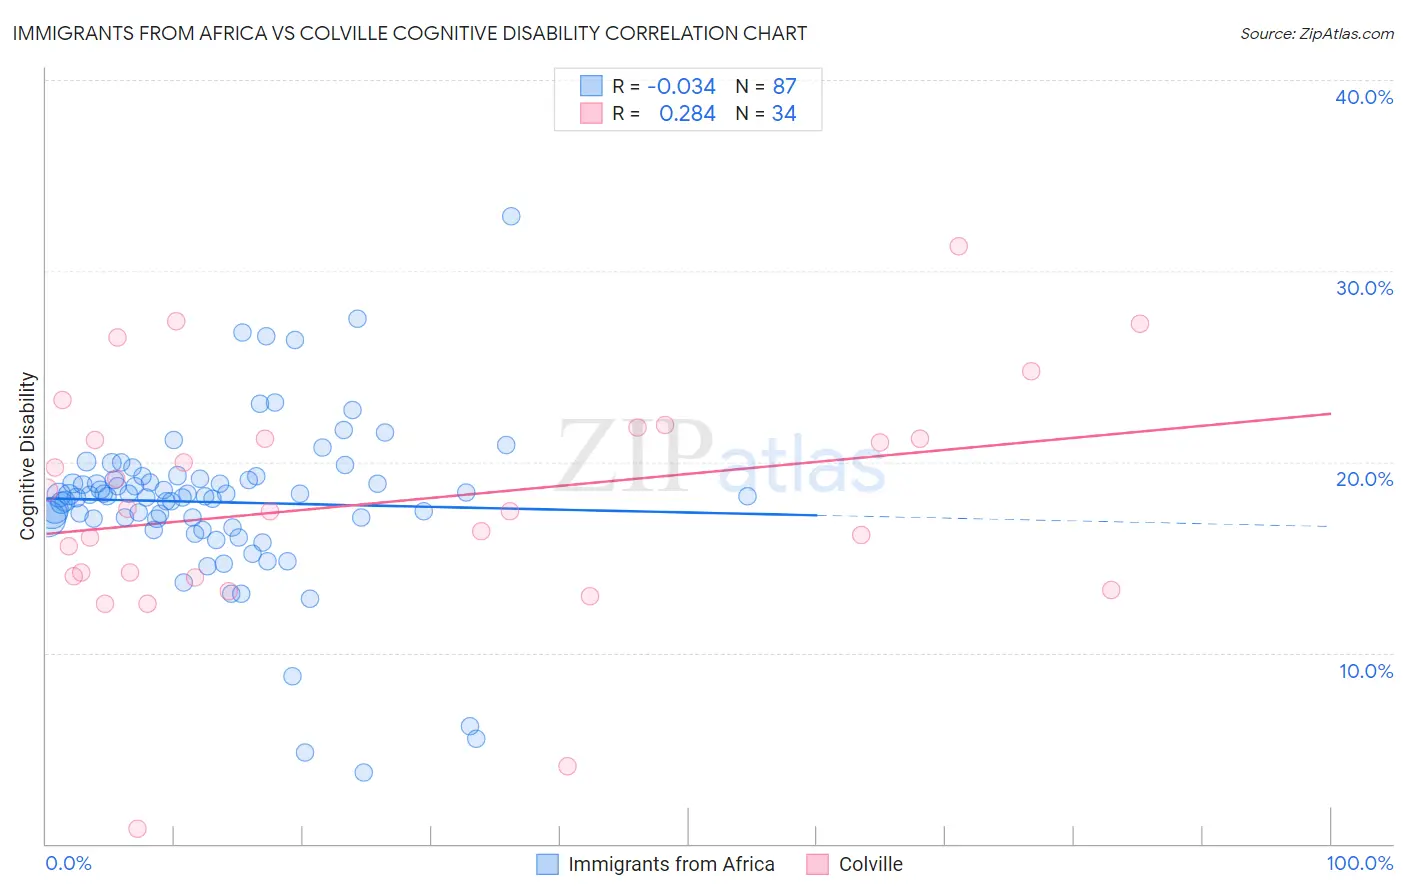
Immigrants from Africa vs Colville Cognitive Disability Correlation Chart
The statistical analysis conducted on geographies consisting of 469,350,662 people shows no correlation between the proportion of Immigrants from Africa and percentage of population with cognitive disability in the United States with a correlation coefficient (R) of -0.034 and weighted average of 18.1%. Similarly, the statistical analysis conducted on geographies consisting of 34,687,480 people shows a weak positive correlation between the proportion of Colville and percentage of population with cognitive disability in the United States with a correlation coefficient (R) of 0.284 and weighted average of 18.3%, a difference of 1.1%.
Cognitive Disability Correlation Summary
| Measurement | Immigrants from Africa | Colville |
| Minimum | 3.7% | 0.79% |
| Maximum | 32.8% | 31.3% |
| Range | 29.1% | 30.5% |
| Mean | 17.9% | 17.9% |
| Median | 18.2% | 17.5% |
| Interquartile 25% (IQ1) | 17.0% | 14.0% |
| Interquartile 75% (IQ3) | 19.1% | 21.2% |
| Interquartile Range (IQR) | 2.1% | 7.2% |
| Standard Deviation (Sample) | 4.3% | 6.2% |
| Standard Deviation (Population) | 4.3% | 6.1% |
Demographics Similar to Immigrants from Africa and Colville by Cognitive Disability
In terms of cognitive disability, the demographic groups most similar to Immigrants from Africa are Native/Alaskan (18.1%, a difference of 0.030%), Immigrants from West Indies (18.1%, a difference of 0.040%), Dutch West Indian (18.1%, a difference of 0.050%), Ottawa (18.2%, a difference of 0.13%), and Iroquois (18.2%, a difference of 0.20%). Similarly, the demographic groups most similar to Colville are Seminole (18.3%, a difference of 0.010%), Ugandan (18.3%, a difference of 0.010%), Immigrants from Eritrea (18.3%, a difference of 0.12%), Immigrants from Kenya (18.3%, a difference of 0.17%), and Barbadian (18.3%, a difference of 0.18%).
| Demographics | Rating | Rank | Cognitive Disability |
| Dutch West Indians | 0.1 /100 | #287 | Tragic 18.1% |
| Immigrants | West Indies | 0.1 /100 | #288 | Tragic 18.1% |
| Natives/Alaskans | 0.1 /100 | #289 | Tragic 18.1% |
| Immigrants | Africa | 0.1 /100 | #290 | Tragic 18.1% |
| Ottawa | 0.1 /100 | #291 | Tragic 18.2% |
| Iroquois | 0.1 /100 | #292 | Tragic 18.2% |
| Central American Indians | 0.1 /100 | #293 | Tragic 18.2% |
| British West Indians | 0.1 /100 | #294 | Tragic 18.2% |
| German Russians | 0.0 /100 | #295 | Tragic 18.2% |
| Immigrants | Burma/Myanmar | 0.0 /100 | #296 | Tragic 18.2% |
| Blackfeet | 0.0 /100 | #297 | Tragic 18.3% |
| Japanese | 0.0 /100 | #298 | Tragic 18.3% |
| Ghanaians | 0.0 /100 | #299 | Tragic 18.3% |
| Creek | 0.0 /100 | #300 | Tragic 18.3% |
| Immigrants | Ghana | 0.0 /100 | #301 | Tragic 18.3% |
| Barbadians | 0.0 /100 | #302 | Tragic 18.3% |
| Immigrants | Kenya | 0.0 /100 | #303 | Tragic 18.3% |
| Immigrants | Eritrea | 0.0 /100 | #304 | Tragic 18.3% |
| Colville | 0.0 /100 | #305 | Tragic 18.3% |
| Seminole | 0.0 /100 | #306 | Tragic 18.3% |
| Ugandans | 0.0 /100 | #307 | Tragic 18.3% |