Czech vs Colville Cognitive Disability
COMPARE
Czech
Colville
Cognitive Disability
Cognitive Disability Comparison
Czechs
Colville
16.4%
COGNITIVE DISABILITY
99.9/ 100
METRIC RATING
30th/ 347
METRIC RANK
18.3%
COGNITIVE DISABILITY
0.0/ 100
METRIC RATING
305th/ 347
METRIC RANK
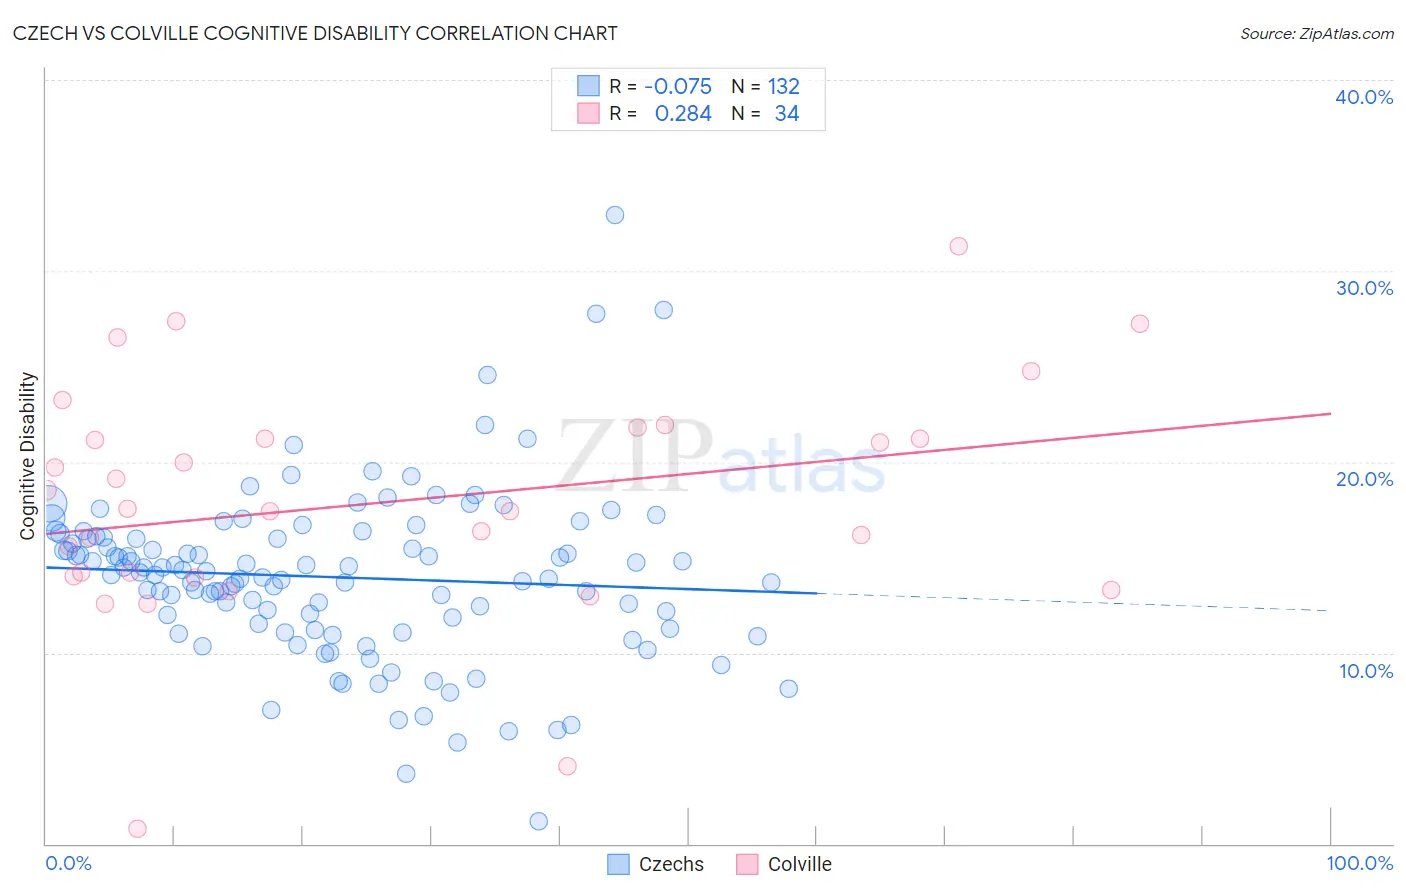
Czech vs Colville Cognitive Disability Correlation Chart
The statistical analysis conducted on geographies consisting of 484,743,035 people shows a slight negative correlation between the proportion of Czechs and percentage of population with cognitive disability in the United States with a correlation coefficient (R) of -0.075 and weighted average of 16.4%. Similarly, the statistical analysis conducted on geographies consisting of 34,687,480 people shows a weak positive correlation between the proportion of Colville and percentage of population with cognitive disability in the United States with a correlation coefficient (R) of 0.284 and weighted average of 18.3%, a difference of 11.9%.
Cognitive Disability Correlation Summary
| Measurement | Czech | Colville |
| Minimum | 1.2% | 0.79% |
| Maximum | 32.9% | 31.3% |
| Range | 31.7% | 30.5% |
| Mean | 14.0% | 17.9% |
| Median | 14.1% | 17.5% |
| Interquartile 25% (IQ1) | 11.4% | 14.0% |
| Interquartile 75% (IQ3) | 16.0% | 21.2% |
| Interquartile Range (IQR) | 4.6% | 7.2% |
| Standard Deviation (Sample) | 4.4% | 6.2% |
| Standard Deviation (Population) | 4.4% | 6.1% |
Similar Demographics by Cognitive Disability
Demographics Similar to Czechs by Cognitive Disability
In terms of cognitive disability, the demographic groups most similar to Czechs are Filipino (16.4%, a difference of 0.0%), Immigrants from Romania (16.4%, a difference of 0.020%), Immigrants from Pakistan (16.4%, a difference of 0.030%), Polish (16.4%, a difference of 0.030%), and Immigrants from Croatia (16.4%, a difference of 0.050%).
| Demographics | Rating | Rank | Cognitive Disability |
| Croatians | 99.9 /100 | #23 | Exceptional 16.4% |
| Immigrants | Argentina | 99.9 /100 | #24 | Exceptional 16.4% |
| Luxembourgers | 99.9 /100 | #25 | Exceptional 16.4% |
| Immigrants | Croatia | 99.9 /100 | #26 | Exceptional 16.4% |
| Immigrants | Pakistan | 99.9 /100 | #27 | Exceptional 16.4% |
| Poles | 99.9 /100 | #28 | Exceptional 16.4% |
| Filipinos | 99.9 /100 | #29 | Exceptional 16.4% |
| Czechs | 99.9 /100 | #30 | Exceptional 16.4% |
| Immigrants | Romania | 99.9 /100 | #31 | Exceptional 16.4% |
| Immigrants | Israel | 99.9 /100 | #32 | Exceptional 16.4% |
| Italians | 99.9 /100 | #33 | Exceptional 16.4% |
| Russians | 99.9 /100 | #34 | Exceptional 16.4% |
| Slovaks | 99.9 /100 | #35 | Exceptional 16.4% |
| Greeks | 99.9 /100 | #36 | Exceptional 16.4% |
| Slovenes | 99.9 /100 | #37 | Exceptional 16.5% |
Demographics Similar to Colville by Cognitive Disability
In terms of cognitive disability, the demographic groups most similar to Colville are Seminole (18.3%, a difference of 0.010%), Ugandan (18.3%, a difference of 0.010%), Immigrants from Western Africa (18.4%, a difference of 0.10%), Immigrants from Eritrea (18.3%, a difference of 0.12%), and Immigrants from Eastern Africa (18.4%, a difference of 0.14%).
| Demographics | Rating | Rank | Cognitive Disability |
| Japanese | 0.0 /100 | #298 | Tragic 18.3% |
| Ghanaians | 0.0 /100 | #299 | Tragic 18.3% |
| Creek | 0.0 /100 | #300 | Tragic 18.3% |
| Immigrants | Ghana | 0.0 /100 | #301 | Tragic 18.3% |
| Barbadians | 0.0 /100 | #302 | Tragic 18.3% |
| Immigrants | Kenya | 0.0 /100 | #303 | Tragic 18.3% |
| Immigrants | Eritrea | 0.0 /100 | #304 | Tragic 18.3% |
| Colville | 0.0 /100 | #305 | Tragic 18.3% |
| Seminole | 0.0 /100 | #306 | Tragic 18.3% |
| Ugandans | 0.0 /100 | #307 | Tragic 18.3% |
| Immigrants | Western Africa | 0.0 /100 | #308 | Tragic 18.4% |
| Immigrants | Eastern Africa | 0.0 /100 | #309 | Tragic 18.4% |
| Choctaw | 0.0 /100 | #310 | Tragic 18.4% |
| Hmong | 0.0 /100 | #311 | Tragic 18.4% |
| Chickasaw | 0.0 /100 | #312 | Tragic 18.5% |