Nigerian vs Immigrants from South Central Asia Cognitive Disability
COMPARE
Nigerian
Immigrants from South Central Asia
Cognitive Disability
Cognitive Disability Comparison
Nigerians
Immigrants from South Central Asia
18.1%
COGNITIVE DISABILITY
0.1/ 100
METRIC RATING
283rd/ 347
METRIC RANK
16.4%
COGNITIVE DISABILITY
99.9/ 100
METRIC RATING
22nd/ 347
METRIC RANK
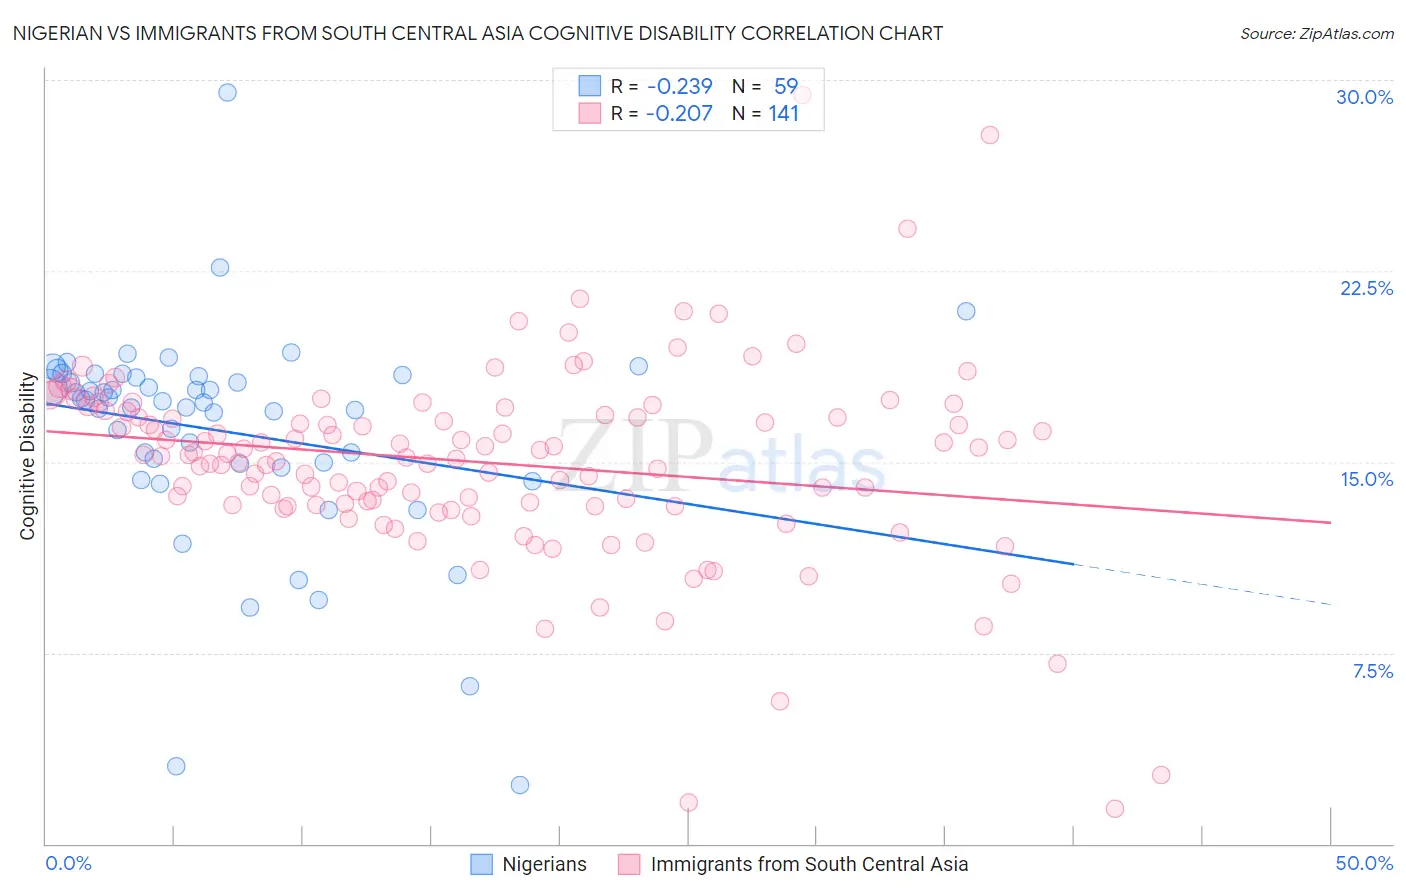
Nigerian vs Immigrants from South Central Asia Cognitive Disability Correlation Chart
The statistical analysis conducted on geographies consisting of 332,733,187 people shows a weak negative correlation between the proportion of Nigerians and percentage of population with cognitive disability in the United States with a correlation coefficient (R) of -0.239 and weighted average of 18.1%. Similarly, the statistical analysis conducted on geographies consisting of 473,055,858 people shows a weak negative correlation between the proportion of Immigrants from South Central Asia and percentage of population with cognitive disability in the United States with a correlation coefficient (R) of -0.207 and weighted average of 16.4%, a difference of 10.7%.
Cognitive Disability Correlation Summary
| Measurement | Nigerian | Immigrants from South Central Asia |
| Minimum | 2.3% | 1.4% |
| Maximum | 29.5% | 29.4% |
| Range | 27.2% | 28.0% |
| Mean | 16.2% | 15.0% |
| Median | 17.4% | 15.3% |
| Interquartile 25% (IQ1) | 14.9% | 13.3% |
| Interquartile 75% (IQ3) | 18.4% | 17.0% |
| Interquartile Range (IQR) | 3.5% | 3.7% |
| Standard Deviation (Sample) | 4.2% | 3.8% |
| Standard Deviation (Population) | 4.2% | 3.8% |
Similar Demographics by Cognitive Disability
Demographics Similar to Nigerians by Cognitive Disability
In terms of cognitive disability, the demographic groups most similar to Nigerians are Immigrants from Cambodia (18.1%, a difference of 0.020%), Immigrants from Uganda (18.1%, a difference of 0.040%), Yakama (18.1%, a difference of 0.050%), Bermudan (18.1%, a difference of 0.050%), and Kenyan (18.1%, a difference of 0.090%).
| Demographics | Rating | Rank | Cognitive Disability |
| Yuman | 0.2 /100 | #276 | Tragic 18.1% |
| Immigrants | Kuwait | 0.2 /100 | #277 | Tragic 18.1% |
| Immigrants | Micronesia | 0.2 /100 | #278 | Tragic 18.1% |
| Chippewa | 0.1 /100 | #279 | Tragic 18.1% |
| West Indians | 0.1 /100 | #280 | Tragic 18.1% |
| Yakama | 0.1 /100 | #281 | Tragic 18.1% |
| Immigrants | Cambodia | 0.1 /100 | #282 | Tragic 18.1% |
| Nigerians | 0.1 /100 | #283 | Tragic 18.1% |
| Immigrants | Uganda | 0.1 /100 | #284 | Tragic 18.1% |
| Bermudans | 0.1 /100 | #285 | Tragic 18.1% |
| Kenyans | 0.1 /100 | #286 | Tragic 18.1% |
| Dutch West Indians | 0.1 /100 | #287 | Tragic 18.1% |
| Immigrants | West Indies | 0.1 /100 | #288 | Tragic 18.1% |
| Natives/Alaskans | 0.1 /100 | #289 | Tragic 18.1% |
| Immigrants | Africa | 0.1 /100 | #290 | Tragic 18.1% |
Demographics Similar to Immigrants from South Central Asia by Cognitive Disability
In terms of cognitive disability, the demographic groups most similar to Immigrants from South Central Asia are Croatian (16.4%, a difference of 0.030%), Immigrants from Argentina (16.4%, a difference of 0.060%), Luxembourger (16.4%, a difference of 0.10%), Immigrants from Cuba (16.3%, a difference of 0.13%), and Immigrants from Croatia (16.4%, a difference of 0.13%).
| Demographics | Rating | Rank | Cognitive Disability |
| Immigrants | Greece | 100.0 /100 | #15 | Exceptional 16.3% |
| Eastern Europeans | 100.0 /100 | #16 | Exceptional 16.3% |
| Immigrants | North Macedonia | 100.0 /100 | #17 | Exceptional 16.3% |
| Immigrants | Northern Europe | 100.0 /100 | #18 | Exceptional 16.3% |
| Immigrants | Bolivia | 100.0 /100 | #19 | Exceptional 16.3% |
| Bulgarians | 100.0 /100 | #20 | Exceptional 16.3% |
| Immigrants | Cuba | 100.0 /100 | #21 | Exceptional 16.3% |
| Immigrants | South Central Asia | 99.9 /100 | #22 | Exceptional 16.4% |
| Croatians | 99.9 /100 | #23 | Exceptional 16.4% |
| Immigrants | Argentina | 99.9 /100 | #24 | Exceptional 16.4% |
| Luxembourgers | 99.9 /100 | #25 | Exceptional 16.4% |
| Immigrants | Croatia | 99.9 /100 | #26 | Exceptional 16.4% |
| Immigrants | Pakistan | 99.9 /100 | #27 | Exceptional 16.4% |
| Poles | 99.9 /100 | #28 | Exceptional 16.4% |
| Filipinos | 99.9 /100 | #29 | Exceptional 16.4% |