Nigerian vs Nonimmigrants Cognitive Disability
COMPARE
Nigerian
Nonimmigrants
Cognitive Disability
Cognitive Disability Comparison
Nigerians
Nonimmigrants
18.1%
COGNITIVE DISABILITY
0.1/ 100
METRIC RATING
283rd/ 347
METRIC RANK
17.4%
COGNITIVE DISABILITY
27.4/ 100
METRIC RATING
191st/ 347
METRIC RANK
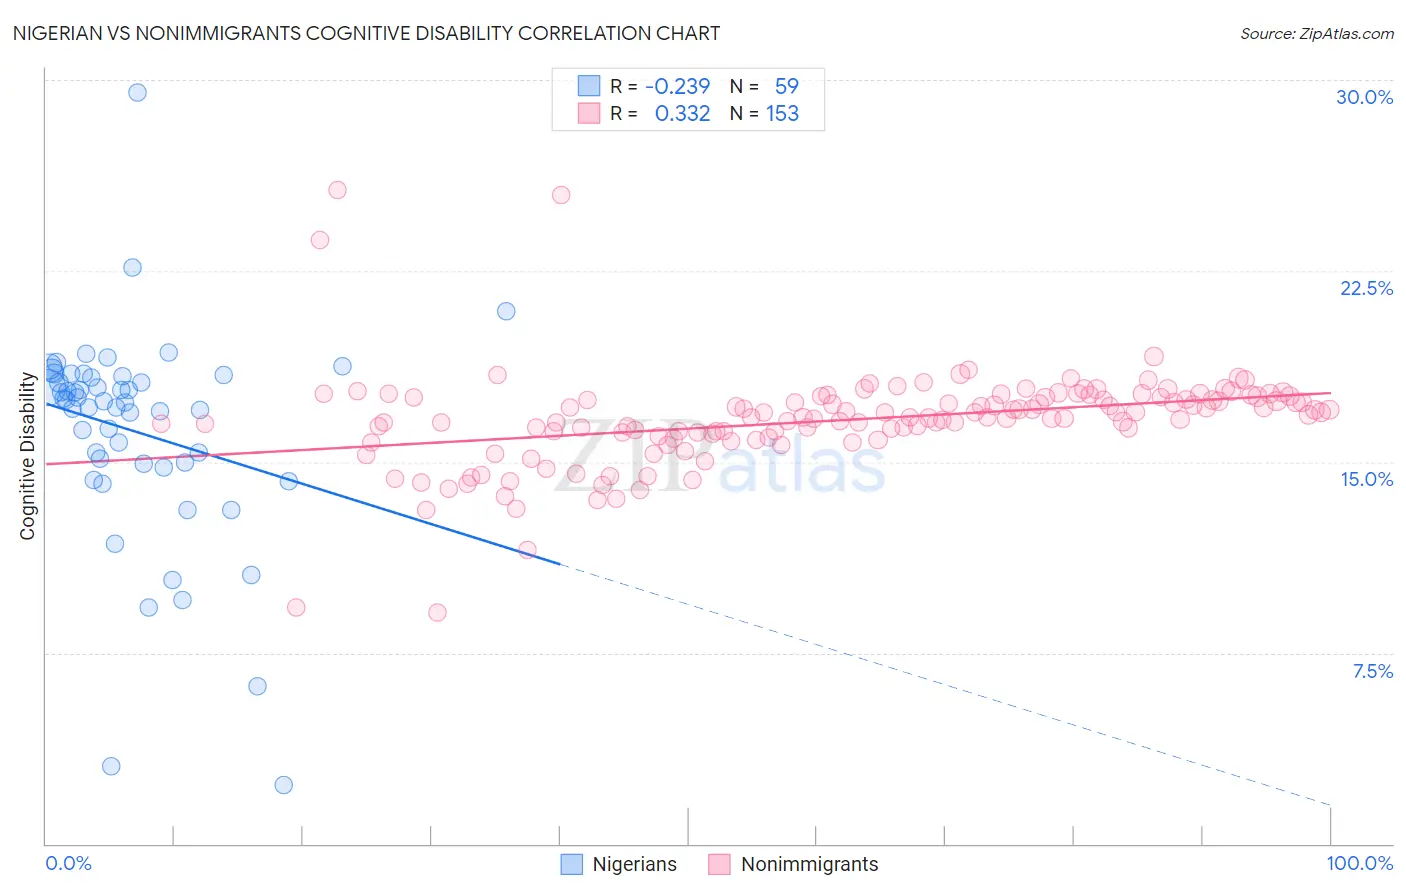
Nigerian vs Nonimmigrants Cognitive Disability Correlation Chart
The statistical analysis conducted on geographies consisting of 332,733,187 people shows a weak negative correlation between the proportion of Nigerians and percentage of population with cognitive disability in the United States with a correlation coefficient (R) of -0.239 and weighted average of 18.1%. Similarly, the statistical analysis conducted on geographies consisting of 584,976,337 people shows a mild positive correlation between the proportion of Nonimmigrants and percentage of population with cognitive disability in the United States with a correlation coefficient (R) of 0.332 and weighted average of 17.4%, a difference of 4.1%.
Cognitive Disability Correlation Summary
| Measurement | Nigerian | Nonimmigrants |
| Minimum | 2.3% | 9.1% |
| Maximum | 29.5% | 25.7% |
| Range | 27.2% | 16.6% |
| Mean | 16.2% | 16.6% |
| Median | 17.4% | 16.8% |
| Interquartile 25% (IQ1) | 14.9% | 16.0% |
| Interquartile 75% (IQ3) | 18.4% | 17.6% |
| Interquartile Range (IQR) | 3.5% | 1.5% |
| Standard Deviation (Sample) | 4.2% | 1.9% |
| Standard Deviation (Population) | 4.2% | 1.9% |
Similar Demographics by Cognitive Disability
Demographics Similar to Nigerians by Cognitive Disability
In terms of cognitive disability, the demographic groups most similar to Nigerians are Immigrants from Cambodia (18.1%, a difference of 0.020%), Immigrants from Uganda (18.1%, a difference of 0.040%), Yakama (18.1%, a difference of 0.050%), Bermudan (18.1%, a difference of 0.050%), and Kenyan (18.1%, a difference of 0.090%).
| Demographics | Rating | Rank | Cognitive Disability |
| Yuman | 0.2 /100 | #276 | Tragic 18.1% |
| Immigrants | Kuwait | 0.2 /100 | #277 | Tragic 18.1% |
| Immigrants | Micronesia | 0.2 /100 | #278 | Tragic 18.1% |
| Chippewa | 0.1 /100 | #279 | Tragic 18.1% |
| West Indians | 0.1 /100 | #280 | Tragic 18.1% |
| Yakama | 0.1 /100 | #281 | Tragic 18.1% |
| Immigrants | Cambodia | 0.1 /100 | #282 | Tragic 18.1% |
| Nigerians | 0.1 /100 | #283 | Tragic 18.1% |
| Immigrants | Uganda | 0.1 /100 | #284 | Tragic 18.1% |
| Bermudans | 0.1 /100 | #285 | Tragic 18.1% |
| Kenyans | 0.1 /100 | #286 | Tragic 18.1% |
| Dutch West Indians | 0.1 /100 | #287 | Tragic 18.1% |
| Immigrants | West Indies | 0.1 /100 | #288 | Tragic 18.1% |
| Natives/Alaskans | 0.1 /100 | #289 | Tragic 18.1% |
| Immigrants | Africa | 0.1 /100 | #290 | Tragic 18.1% |
Demographics Similar to Nonimmigrants by Cognitive Disability
In terms of cognitive disability, the demographic groups most similar to Nonimmigrants are Immigrants from Spain (17.4%, a difference of 0.010%), Immigrants from Haiti (17.4%, a difference of 0.010%), Delaware (17.4%, a difference of 0.060%), Immigrants from Western Asia (17.4%, a difference of 0.070%), and Immigrants from France (17.4%, a difference of 0.080%).
| Demographics | Rating | Rank | Cognitive Disability |
| Crow | 39.1 /100 | #184 | Fair 17.3% |
| Afghans | 38.2 /100 | #185 | Fair 17.3% |
| Cambodians | 35.9 /100 | #186 | Fair 17.3% |
| Immigrants | Fiji | 33.7 /100 | #187 | Fair 17.4% |
| Immigrants | France | 29.8 /100 | #188 | Fair 17.4% |
| Immigrants | Western Asia | 29.5 /100 | #189 | Fair 17.4% |
| Immigrants | Spain | 27.7 /100 | #190 | Fair 17.4% |
| Immigrants | Nonimmigrants | 27.4 /100 | #191 | Fair 17.4% |
| Immigrants | Haiti | 27.1 /100 | #192 | Fair 17.4% |
| Delaware | 25.6 /100 | #193 | Fair 17.4% |
| Immigrants | Bosnia and Herzegovina | 22.0 /100 | #194 | Fair 17.4% |
| New Zealanders | 21.1 /100 | #195 | Fair 17.4% |
| Guyanese | 17.5 /100 | #196 | Poor 17.5% |
| Immigrants | Afghanistan | 16.7 /100 | #197 | Poor 17.5% |
| Immigrants | Panama | 14.8 /100 | #198 | Poor 17.5% |