Nigerian vs European Cognitive Disability
COMPARE
Nigerian
European
Cognitive Disability
Cognitive Disability Comparison
Nigerians
Europeans
18.1%
COGNITIVE DISABILITY
0.1/ 100
METRIC RATING
283rd/ 347
METRIC RANK
17.0%
COGNITIVE DISABILITY
93.4/ 100
METRIC RATING
126th/ 347
METRIC RANK
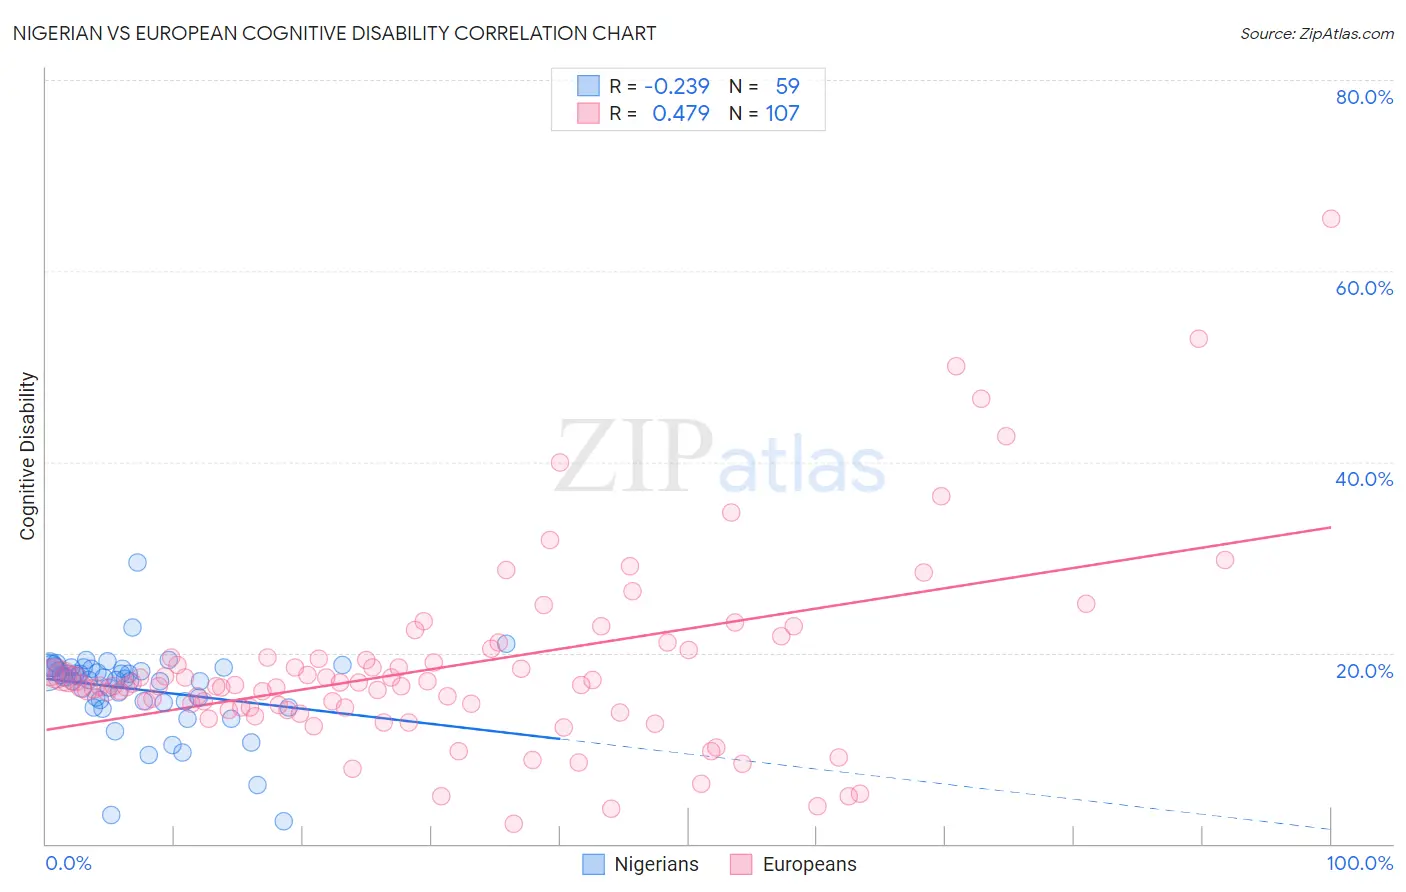
Nigerian vs European Cognitive Disability Correlation Chart
The statistical analysis conducted on geographies consisting of 332,733,187 people shows a weak negative correlation between the proportion of Nigerians and percentage of population with cognitive disability in the United States with a correlation coefficient (R) of -0.239 and weighted average of 18.1%. Similarly, the statistical analysis conducted on geographies consisting of 561,683,346 people shows a moderate positive correlation between the proportion of Europeans and percentage of population with cognitive disability in the United States with a correlation coefficient (R) of 0.479 and weighted average of 17.0%, a difference of 6.9%.
Cognitive Disability Correlation Summary
| Measurement | Nigerian | European |
| Minimum | 2.3% | 2.1% |
| Maximum | 29.5% | 65.5% |
| Range | 27.2% | 63.4% |
| Mean | 16.2% | 18.5% |
| Median | 17.4% | 16.6% |
| Interquartile 25% (IQ1) | 14.9% | 14.2% |
| Interquartile 75% (IQ3) | 18.4% | 19.6% |
| Interquartile Range (IQR) | 3.5% | 5.3% |
| Standard Deviation (Sample) | 4.2% | 9.9% |
| Standard Deviation (Population) | 4.2% | 9.9% |
Similar Demographics by Cognitive Disability
Demographics Similar to Nigerians by Cognitive Disability
In terms of cognitive disability, the demographic groups most similar to Nigerians are Immigrants from Cambodia (18.1%, a difference of 0.020%), Immigrants from Uganda (18.1%, a difference of 0.040%), Yakama (18.1%, a difference of 0.050%), Bermudan (18.1%, a difference of 0.050%), and Kenyan (18.1%, a difference of 0.090%).
| Demographics | Rating | Rank | Cognitive Disability |
| Yuman | 0.2 /100 | #276 | Tragic 18.1% |
| Immigrants | Kuwait | 0.2 /100 | #277 | Tragic 18.1% |
| Immigrants | Micronesia | 0.2 /100 | #278 | Tragic 18.1% |
| Chippewa | 0.1 /100 | #279 | Tragic 18.1% |
| West Indians | 0.1 /100 | #280 | Tragic 18.1% |
| Yakama | 0.1 /100 | #281 | Tragic 18.1% |
| Immigrants | Cambodia | 0.1 /100 | #282 | Tragic 18.1% |
| Nigerians | 0.1 /100 | #283 | Tragic 18.1% |
| Immigrants | Uganda | 0.1 /100 | #284 | Tragic 18.1% |
| Bermudans | 0.1 /100 | #285 | Tragic 18.1% |
| Kenyans | 0.1 /100 | #286 | Tragic 18.1% |
| Dutch West Indians | 0.1 /100 | #287 | Tragic 18.1% |
| Immigrants | West Indies | 0.1 /100 | #288 | Tragic 18.1% |
| Natives/Alaskans | 0.1 /100 | #289 | Tragic 18.1% |
| Immigrants | Africa | 0.1 /100 | #290 | Tragic 18.1% |
Demographics Similar to Europeans by Cognitive Disability
In terms of cognitive disability, the demographic groups most similar to Europeans are Immigrants from Costa Rica (17.0%, a difference of 0.040%), Nicaraguan (17.0%, a difference of 0.050%), Immigrants from Uruguay (17.0%, a difference of 0.060%), Scandinavian (16.9%, a difference of 0.090%), and Immigrants from Vietnam (17.0%, a difference of 0.12%).
| Demographics | Rating | Rank | Cognitive Disability |
| South Africans | 95.5 /100 | #119 | Exceptional 16.9% |
| Scottish | 95.0 /100 | #120 | Exceptional 16.9% |
| Immigrants | China | 94.9 /100 | #121 | Exceptional 16.9% |
| Immigrants | Western Europe | 94.8 /100 | #122 | Exceptional 16.9% |
| Portuguese | 94.7 /100 | #123 | Exceptional 16.9% |
| Turks | 94.5 /100 | #124 | Exceptional 16.9% |
| Scandinavians | 94.1 /100 | #125 | Exceptional 16.9% |
| Europeans | 93.4 /100 | #126 | Exceptional 17.0% |
| Immigrants | Costa Rica | 93.1 /100 | #127 | Exceptional 17.0% |
| Nicaraguans | 93.0 /100 | #128 | Exceptional 17.0% |
| Immigrants | Uruguay | 92.9 /100 | #129 | Exceptional 17.0% |
| Immigrants | Vietnam | 92.4 /100 | #130 | Exceptional 17.0% |
| Immigrants | Germany | 92.1 /100 | #131 | Exceptional 17.0% |
| Whites/Caucasians | 92.1 /100 | #132 | Exceptional 17.0% |
| Immigrants | Jordan | 91.9 /100 | #133 | Exceptional 17.0% |