Nigerian vs Yup'ik Cognitive Disability
COMPARE
Nigerian
Yup'ik
Cognitive Disability
Cognitive Disability Comparison
Nigerians
Yup'ik
18.1%
COGNITIVE DISABILITY
0.1/ 100
METRIC RATING
283rd/ 347
METRIC RANK
16.9%
COGNITIVE DISABILITY
96.9/ 100
METRIC RATING
115th/ 347
METRIC RANK
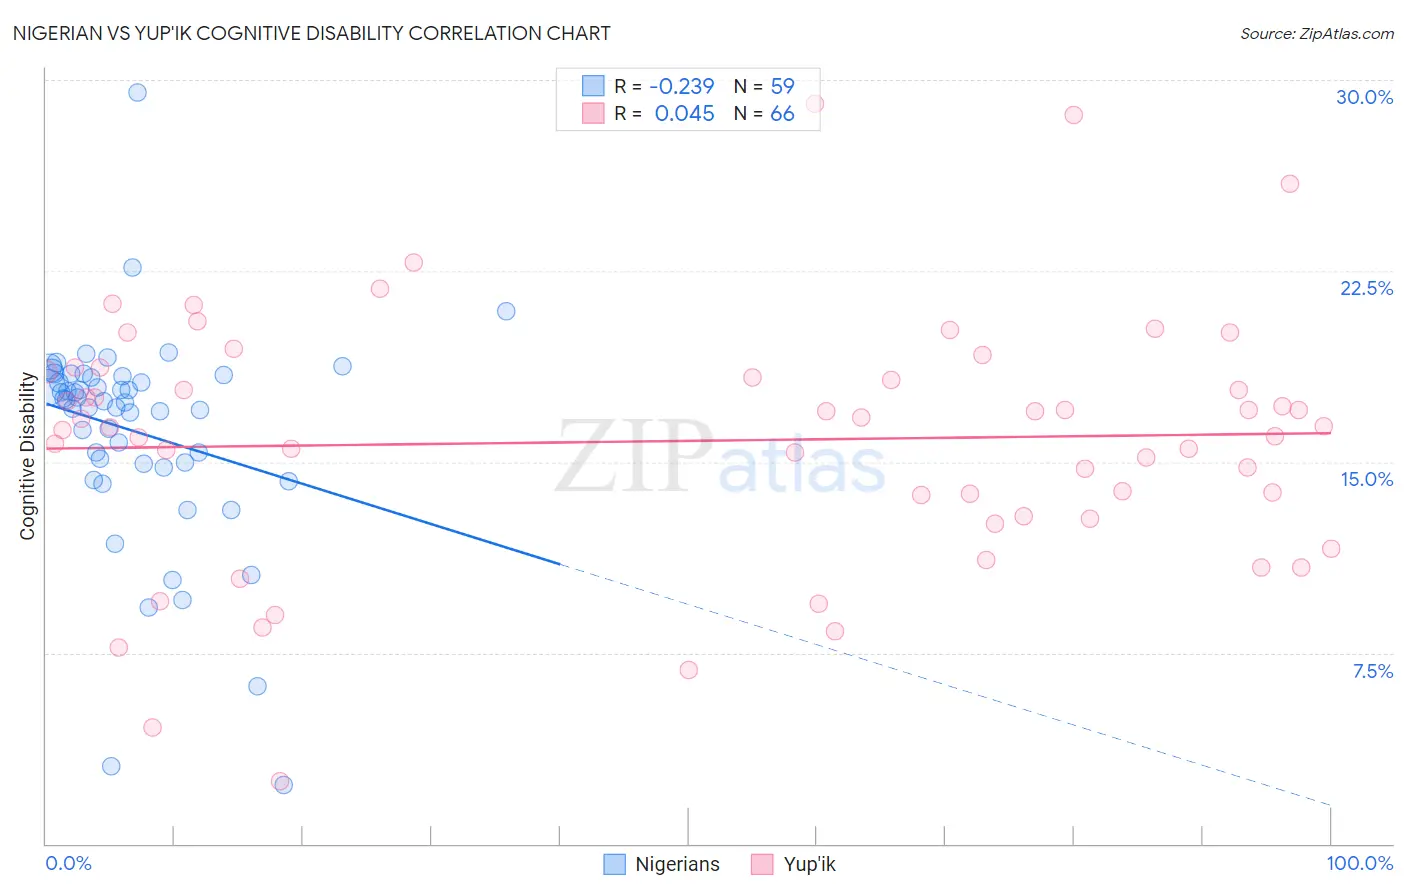
Nigerian vs Yup'ik Cognitive Disability Correlation Chart
The statistical analysis conducted on geographies consisting of 332,733,187 people shows a weak negative correlation between the proportion of Nigerians and percentage of population with cognitive disability in the United States with a correlation coefficient (R) of -0.239 and weighted average of 18.1%. Similarly, the statistical analysis conducted on geographies consisting of 39,961,414 people shows no correlation between the proportion of Yup'ik and percentage of population with cognitive disability in the United States with a correlation coefficient (R) of 0.045 and weighted average of 16.9%, a difference of 7.5%.
Cognitive Disability Correlation Summary
| Measurement | Nigerian | Yup'ik |
| Minimum | 2.3% | 2.5% |
| Maximum | 29.5% | 29.1% |
| Range | 27.2% | 26.6% |
| Mean | 16.2% | 15.8% |
| Median | 17.4% | 16.4% |
| Interquartile 25% (IQ1) | 14.9% | 12.9% |
| Interquartile 75% (IQ3) | 18.4% | 18.5% |
| Interquartile Range (IQR) | 3.5% | 5.7% |
| Standard Deviation (Sample) | 4.2% | 5.0% |
| Standard Deviation (Population) | 4.2% | 5.0% |
Similar Demographics by Cognitive Disability
Demographics Similar to Nigerians by Cognitive Disability
In terms of cognitive disability, the demographic groups most similar to Nigerians are Immigrants from Cambodia (18.1%, a difference of 0.020%), Immigrants from Uganda (18.1%, a difference of 0.040%), Yakama (18.1%, a difference of 0.050%), Bermudan (18.1%, a difference of 0.050%), and Kenyan (18.1%, a difference of 0.090%).
| Demographics | Rating | Rank | Cognitive Disability |
| Yuman | 0.2 /100 | #276 | Tragic 18.1% |
| Immigrants | Kuwait | 0.2 /100 | #277 | Tragic 18.1% |
| Immigrants | Micronesia | 0.2 /100 | #278 | Tragic 18.1% |
| Chippewa | 0.1 /100 | #279 | Tragic 18.1% |
| West Indians | 0.1 /100 | #280 | Tragic 18.1% |
| Yakama | 0.1 /100 | #281 | Tragic 18.1% |
| Immigrants | Cambodia | 0.1 /100 | #282 | Tragic 18.1% |
| Nigerians | 0.1 /100 | #283 | Tragic 18.1% |
| Immigrants | Uganda | 0.1 /100 | #284 | Tragic 18.1% |
| Bermudans | 0.1 /100 | #285 | Tragic 18.1% |
| Kenyans | 0.1 /100 | #286 | Tragic 18.1% |
| Dutch West Indians | 0.1 /100 | #287 | Tragic 18.1% |
| Immigrants | West Indies | 0.1 /100 | #288 | Tragic 18.1% |
| Natives/Alaskans | 0.1 /100 | #289 | Tragic 18.1% |
| Immigrants | Africa | 0.1 /100 | #290 | Tragic 18.1% |
Demographics Similar to Yup'ik by Cognitive Disability
In terms of cognitive disability, the demographic groups most similar to Yup'ik are Korean (16.8%, a difference of 0.050%), Indian (Asian) (16.8%, a difference of 0.060%), Immigrants from Sri Lanka (16.8%, a difference of 0.060%), Uruguayan (16.8%, a difference of 0.080%), and Arapaho (16.8%, a difference of 0.090%).
| Demographics | Rating | Rank | Cognitive Disability |
| Canadians | 97.5 /100 | #108 | Exceptional 16.8% |
| Albanians | 97.3 /100 | #109 | Exceptional 16.8% |
| Arapaho | 97.3 /100 | #110 | Exceptional 16.8% |
| Uruguayans | 97.2 /100 | #111 | Exceptional 16.8% |
| Indians (Asian) | 97.2 /100 | #112 | Exceptional 16.8% |
| Immigrants | Sri Lanka | 97.1 /100 | #113 | Exceptional 16.8% |
| Koreans | 97.1 /100 | #114 | Exceptional 16.8% |
| Yup'ik | 96.9 /100 | #115 | Exceptional 16.9% |
| Inupiat | 96.5 /100 | #116 | Exceptional 16.9% |
| Immigrants | Japan | 96.2 /100 | #117 | Exceptional 16.9% |
| Immigrants | Denmark | 96.2 /100 | #118 | Exceptional 16.9% |
| South Africans | 95.5 /100 | #119 | Exceptional 16.9% |
| Scottish | 95.0 /100 | #120 | Exceptional 16.9% |
| Immigrants | China | 94.9 /100 | #121 | Exceptional 16.9% |
| Immigrants | Western Europe | 94.8 /100 | #122 | Exceptional 16.9% |