Nigerian vs Immigrants from Dominica Cognitive Disability
COMPARE
Nigerian
Immigrants from Dominica
Cognitive Disability
Cognitive Disability Comparison
Nigerians
Immigrants from Dominica
18.1%
COGNITIVE DISABILITY
0.1/ 100
METRIC RATING
283rd/ 347
METRIC RANK
18.6%
COGNITIVE DISABILITY
0.0/ 100
METRIC RATING
315th/ 347
METRIC RANK
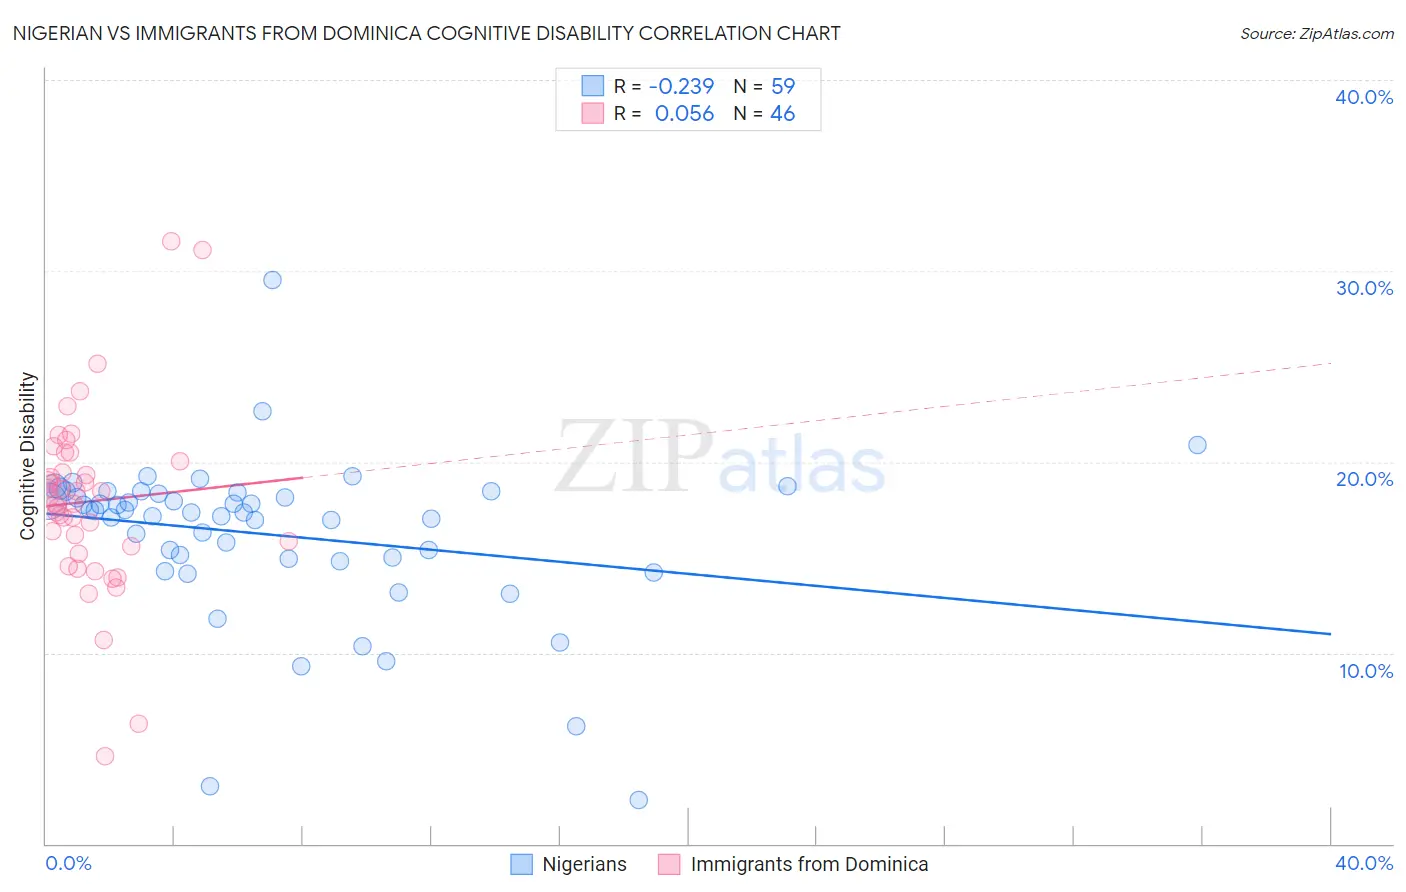
Nigerian vs Immigrants from Dominica Cognitive Disability Correlation Chart
The statistical analysis conducted on geographies consisting of 332,733,187 people shows a weak negative correlation between the proportion of Nigerians and percentage of population with cognitive disability in the United States with a correlation coefficient (R) of -0.239 and weighted average of 18.1%. Similarly, the statistical analysis conducted on geographies consisting of 83,793,635 people shows a slight positive correlation between the proportion of Immigrants from Dominica and percentage of population with cognitive disability in the United States with a correlation coefficient (R) of 0.056 and weighted average of 18.6%, a difference of 2.5%.
Cognitive Disability Correlation Summary
| Measurement | Nigerian | Immigrants from Dominica |
| Minimum | 2.3% | 4.6% |
| Maximum | 29.5% | 31.5% |
| Range | 27.2% | 27.0% |
| Mean | 16.2% | 17.9% |
| Median | 17.4% | 18.0% |
| Interquartile 25% (IQ1) | 14.9% | 15.6% |
| Interquartile 75% (IQ3) | 18.4% | 20.0% |
| Interquartile Range (IQR) | 3.5% | 4.5% |
| Standard Deviation (Sample) | 4.2% | 4.8% |
| Standard Deviation (Population) | 4.2% | 4.8% |
Similar Demographics by Cognitive Disability
Demographics Similar to Nigerians by Cognitive Disability
In terms of cognitive disability, the demographic groups most similar to Nigerians are Immigrants from Cambodia (18.1%, a difference of 0.020%), Immigrants from Uganda (18.1%, a difference of 0.040%), Yakama (18.1%, a difference of 0.050%), Bermudan (18.1%, a difference of 0.050%), and Kenyan (18.1%, a difference of 0.090%).
| Demographics | Rating | Rank | Cognitive Disability |
| Yuman | 0.2 /100 | #276 | Tragic 18.1% |
| Immigrants | Kuwait | 0.2 /100 | #277 | Tragic 18.1% |
| Immigrants | Micronesia | 0.2 /100 | #278 | Tragic 18.1% |
| Chippewa | 0.1 /100 | #279 | Tragic 18.1% |
| West Indians | 0.1 /100 | #280 | Tragic 18.1% |
| Yakama | 0.1 /100 | #281 | Tragic 18.1% |
| Immigrants | Cambodia | 0.1 /100 | #282 | Tragic 18.1% |
| Nigerians | 0.1 /100 | #283 | Tragic 18.1% |
| Immigrants | Uganda | 0.1 /100 | #284 | Tragic 18.1% |
| Bermudans | 0.1 /100 | #285 | Tragic 18.1% |
| Kenyans | 0.1 /100 | #286 | Tragic 18.1% |
| Dutch West Indians | 0.1 /100 | #287 | Tragic 18.1% |
| Immigrants | West Indies | 0.1 /100 | #288 | Tragic 18.1% |
| Natives/Alaskans | 0.1 /100 | #289 | Tragic 18.1% |
| Immigrants | Africa | 0.1 /100 | #290 | Tragic 18.1% |
Demographics Similar to Immigrants from Dominica by Cognitive Disability
In terms of cognitive disability, the demographic groups most similar to Immigrants from Dominica are Immigrants from Middle Africa (18.6%, a difference of 0.080%), Liberian (18.6%, a difference of 0.16%), Subsaharan African (18.5%, a difference of 0.18%), Yaqui (18.5%, a difference of 0.24%), and Bangladeshi (18.6%, a difference of 0.28%).
| Demographics | Rating | Rank | Cognitive Disability |
| Immigrants | Western Africa | 0.0 /100 | #308 | Tragic 18.4% |
| Immigrants | Eastern Africa | 0.0 /100 | #309 | Tragic 18.4% |
| Choctaw | 0.0 /100 | #310 | Tragic 18.4% |
| Hmong | 0.0 /100 | #311 | Tragic 18.4% |
| Chickasaw | 0.0 /100 | #312 | Tragic 18.5% |
| Yaqui | 0.0 /100 | #313 | Tragic 18.5% |
| Sub-Saharan Africans | 0.0 /100 | #314 | Tragic 18.5% |
| Immigrants | Dominica | 0.0 /100 | #315 | Tragic 18.6% |
| Immigrants | Middle Africa | 0.0 /100 | #316 | Tragic 18.6% |
| Liberians | 0.0 /100 | #317 | Tragic 18.6% |
| Bangladeshis | 0.0 /100 | #318 | Tragic 18.6% |
| Comanche | 0.0 /100 | #319 | Tragic 18.6% |
| Apache | 0.0 /100 | #320 | Tragic 18.6% |
| Africans | 0.0 /100 | #321 | Tragic 18.6% |
| Immigrants | Liberia | 0.0 /100 | #322 | Tragic 18.7% |