Nicaraguan vs Aleut Hearing Disability
COMPARE
Nicaraguan
Aleut
Hearing Disability
Hearing Disability Comparison
Nicaraguans
Aleuts
2.7%
HEARING DISABILITY
97.9/ 100
METRIC RATING
69th/ 347
METRIC RANK
4.3%
HEARING DISABILITY
0.0/ 100
METRIC RATING
334th/ 347
METRIC RANK
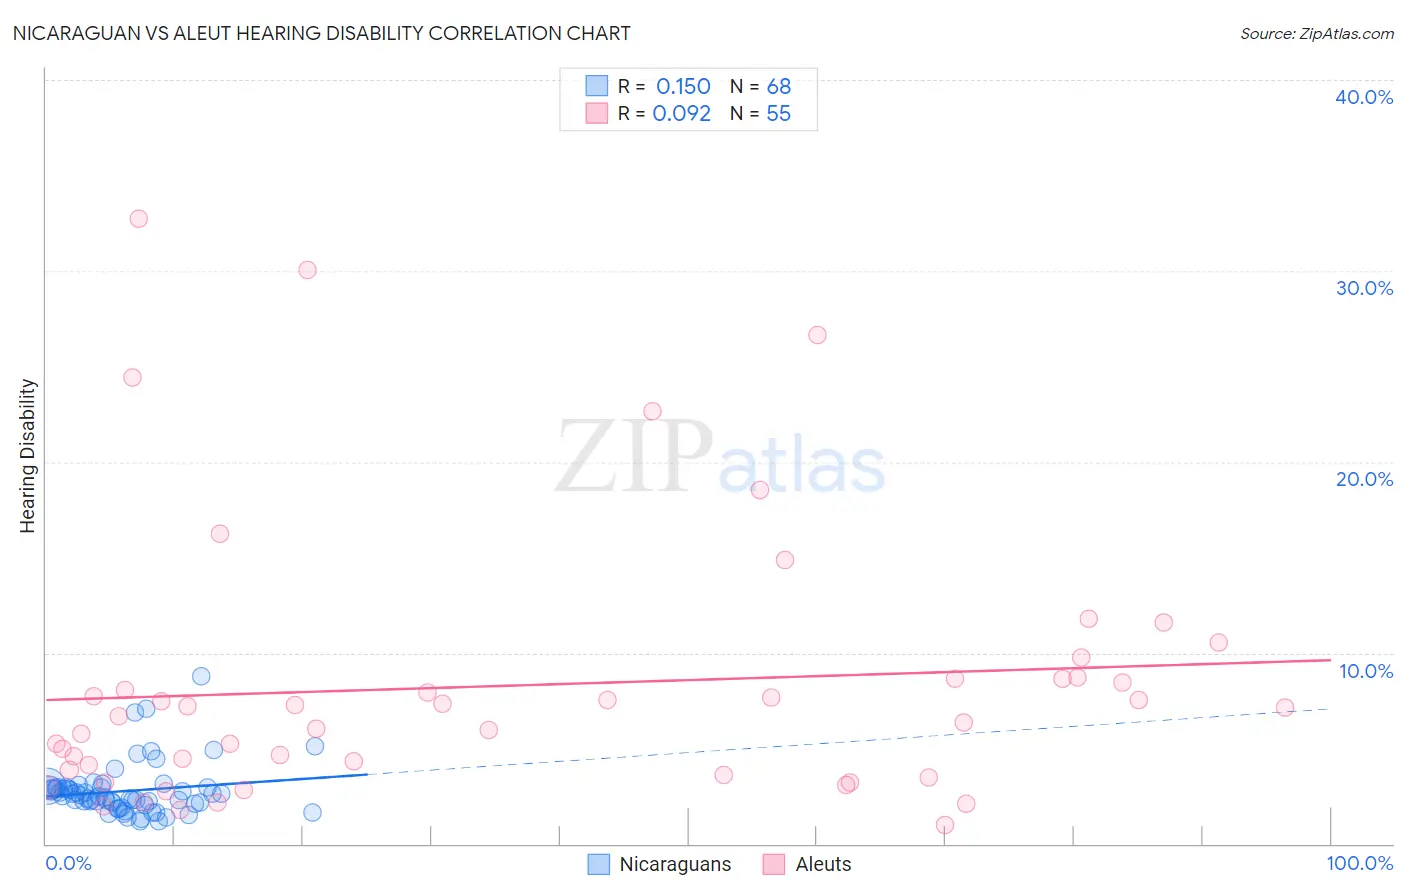
Nicaraguan vs Aleut Hearing Disability Correlation Chart
The statistical analysis conducted on geographies consisting of 285,654,753 people shows a poor positive correlation between the proportion of Nicaraguans and percentage of population with hearing disability in the United States with a correlation coefficient (R) of 0.150 and weighted average of 2.7%. Similarly, the statistical analysis conducted on geographies consisting of 61,781,709 people shows a slight positive correlation between the proportion of Aleuts and percentage of population with hearing disability in the United States with a correlation coefficient (R) of 0.092 and weighted average of 4.3%, a difference of 57.2%.
Hearing Disability Correlation Summary
| Measurement | Nicaraguan | Aleut |
| Minimum | 1.2% | 0.97% |
| Maximum | 8.8% | 32.7% |
| Range | 7.6% | 31.7% |
| Mean | 2.8% | 8.3% |
| Median | 2.5% | 6.7% |
| Interquartile 25% (IQ1) | 2.1% | 3.6% |
| Interquartile 75% (IQ3) | 2.9% | 8.6% |
| Interquartile Range (IQR) | 0.81% | 5.0% |
| Standard Deviation (Sample) | 1.4% | 7.1% |
| Standard Deviation (Population) | 1.3% | 7.1% |
Similar Demographics by Hearing Disability
Demographics Similar to Nicaraguans by Hearing Disability
In terms of hearing disability, the demographic groups most similar to Nicaraguans are Immigrants from Africa (2.7%, a difference of 0.040%), Egyptian (2.7%, a difference of 0.17%), Peruvian (2.7%, a difference of 0.23%), Central American (2.7%, a difference of 0.28%), and Afghan (2.7%, a difference of 0.38%).
| Demographics | Rating | Rank | Hearing Disability |
| Immigrants | Colombia | 98.4 /100 | #62 | Exceptional 2.7% |
| Indians (Asian) | 98.4 /100 | #63 | Exceptional 2.7% |
| Immigrants | Sri Lanka | 98.4 /100 | #64 | Exceptional 2.7% |
| Immigrants | Nepal | 98.3 /100 | #65 | Exceptional 2.7% |
| Immigrants | Belize | 98.2 /100 | #66 | Exceptional 2.7% |
| Egyptians | 98.1 /100 | #67 | Exceptional 2.7% |
| Immigrants | Africa | 98.0 /100 | #68 | Exceptional 2.7% |
| Nicaraguans | 97.9 /100 | #69 | Exceptional 2.7% |
| Peruvians | 97.7 /100 | #70 | Exceptional 2.7% |
| Central Americans | 97.7 /100 | #71 | Exceptional 2.7% |
| Afghans | 97.6 /100 | #72 | Exceptional 2.7% |
| Argentineans | 97.5 /100 | #73 | Exceptional 2.7% |
| Immigrants | Korea | 97.5 /100 | #74 | Exceptional 2.7% |
| Immigrants | Saudi Arabia | 97.5 /100 | #75 | Exceptional 2.7% |
| Asians | 97.5 /100 | #76 | Exceptional 2.7% |
Demographics Similar to Aleuts by Hearing Disability
In terms of hearing disability, the demographic groups most similar to Aleuts are Dutch West Indian (4.3%, a difference of 0.54%), Houma (4.2%, a difference of 1.1%), Kiowa (4.3%, a difference of 1.3%), Cherokee (4.2%, a difference of 1.8%), and Native/Alaskan (4.2%, a difference of 2.0%).
| Demographics | Rating | Rank | Hearing Disability |
| Arapaho | 0.0 /100 | #327 | Tragic 4.1% |
| Tohono O'odham | 0.0 /100 | #328 | Tragic 4.2% |
| Crow | 0.0 /100 | #329 | Tragic 4.2% |
| Natives/Alaskans | 0.0 /100 | #330 | Tragic 4.2% |
| Cherokee | 0.0 /100 | #331 | Tragic 4.2% |
| Houma | 0.0 /100 | #332 | Tragic 4.2% |
| Dutch West Indians | 0.0 /100 | #333 | Tragic 4.3% |
| Aleuts | 0.0 /100 | #334 | Tragic 4.3% |
| Kiowa | 0.0 /100 | #335 | Tragic 4.3% |
| Creek | 0.0 /100 | #336 | Tragic 4.4% |
| Chickasaw | 0.0 /100 | #337 | Tragic 4.5% |
| Alaska Natives | 0.0 /100 | #338 | Tragic 4.5% |
| Choctaw | 0.0 /100 | #339 | Tragic 4.5% |
| Pueblo | 0.0 /100 | #340 | Tragic 4.6% |
| Navajo | 0.0 /100 | #341 | Tragic 4.6% |