Immigrants from Ethiopia vs Immigrants from Korea Hearing Disability
COMPARE
Immigrants from Ethiopia
Immigrants from Korea
Hearing Disability
Hearing Disability Comparison
Immigrants from Ethiopia
Immigrants from Korea
2.7%
HEARING DISABILITY
99.0/ 100
METRIC RATING
55th/ 347
METRIC RANK
2.7%
HEARING DISABILITY
97.5/ 100
METRIC RATING
74th/ 347
METRIC RANK
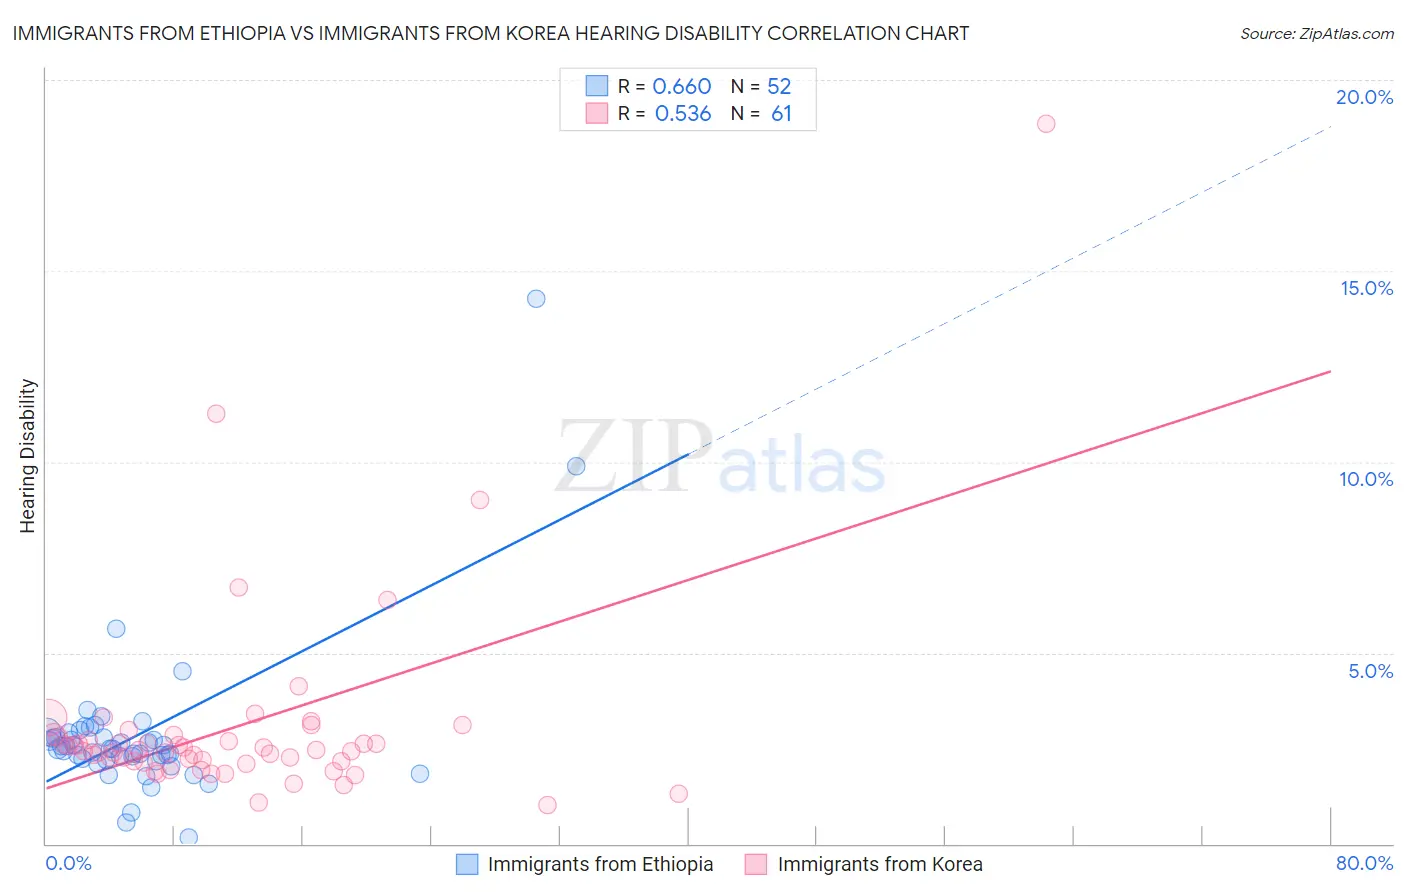
Immigrants from Ethiopia vs Immigrants from Korea Hearing Disability Correlation Chart
The statistical analysis conducted on geographies consisting of 211,510,601 people shows a significant positive correlation between the proportion of Immigrants from Ethiopia and percentage of population with hearing disability in the United States with a correlation coefficient (R) of 0.660 and weighted average of 2.7%. Similarly, the statistical analysis conducted on geographies consisting of 416,138,137 people shows a substantial positive correlation between the proportion of Immigrants from Korea and percentage of population with hearing disability in the United States with a correlation coefficient (R) of 0.536 and weighted average of 2.7%, a difference of 2.4%.
Hearing Disability Correlation Summary
| Measurement | Immigrants from Ethiopia | Immigrants from Korea |
| Minimum | 0.17% | 1.0% |
| Maximum | 14.3% | 18.9% |
| Range | 14.1% | 17.8% |
| Mean | 2.8% | 3.1% |
| Median | 2.5% | 2.5% |
| Interquartile 25% (IQ1) | 2.2% | 2.1% |
| Interquartile 75% (IQ3) | 2.9% | 2.8% |
| Interquartile Range (IQR) | 0.64% | 0.67% |
| Standard Deviation (Sample) | 2.1% | 2.6% |
| Standard Deviation (Population) | 2.1% | 2.6% |
Demographics Similar to Immigrants from Ethiopia and Immigrants from Korea by Hearing Disability
In terms of hearing disability, the demographic groups most similar to Immigrants from Ethiopia are Immigrants from Nicaragua (2.7%, a difference of 0.020%), Ethiopian (2.7%, a difference of 0.060%), South American (2.7%, a difference of 0.070%), Immigrants from Peru (2.7%, a difference of 0.84%), and Immigrants from Eritrea (2.7%, a difference of 0.95%). Similarly, the demographic groups most similar to Immigrants from Korea are Argentinean (2.7%, a difference of 0.0%), Afghan (2.7%, a difference of 0.080%), Central American (2.7%, a difference of 0.18%), Peruvian (2.7%, a difference of 0.23%), and Nicaraguan (2.7%, a difference of 0.46%).
| Demographics | Rating | Rank | Hearing Disability |
| Ethiopians | 99.0 /100 | #54 | Exceptional 2.7% |
| Immigrants | Ethiopia | 99.0 /100 | #55 | Exceptional 2.7% |
| Immigrants | Nicaragua | 99.0 /100 | #56 | Exceptional 2.7% |
| South Americans | 99.0 /100 | #57 | Exceptional 2.7% |
| Immigrants | Peru | 98.6 /100 | #58 | Exceptional 2.7% |
| Immigrants | Eritrea | 98.5 /100 | #59 | Exceptional 2.7% |
| Immigrants | Egypt | 98.5 /100 | #60 | Exceptional 2.7% |
| Immigrants | Uzbekistan | 98.4 /100 | #61 | Exceptional 2.7% |
| Immigrants | Colombia | 98.4 /100 | #62 | Exceptional 2.7% |
| Indians (Asian) | 98.4 /100 | #63 | Exceptional 2.7% |
| Immigrants | Sri Lanka | 98.4 /100 | #64 | Exceptional 2.7% |
| Immigrants | Nepal | 98.3 /100 | #65 | Exceptional 2.7% |
| Immigrants | Belize | 98.2 /100 | #66 | Exceptional 2.7% |
| Egyptians | 98.1 /100 | #67 | Exceptional 2.7% |
| Immigrants | Africa | 98.0 /100 | #68 | Exceptional 2.7% |
| Nicaraguans | 97.9 /100 | #69 | Exceptional 2.7% |
| Peruvians | 97.7 /100 | #70 | Exceptional 2.7% |
| Central Americans | 97.7 /100 | #71 | Exceptional 2.7% |
| Afghans | 97.6 /100 | #72 | Exceptional 2.7% |
| Argentineans | 97.5 /100 | #73 | Exceptional 2.7% |
| Immigrants | Korea | 97.5 /100 | #74 | Exceptional 2.7% |