Israeli vs Immigrants from Korea Hearing Disability
COMPARE
Israeli
Immigrants from Korea
Hearing Disability
Hearing Disability Comparison
Israelis
Immigrants from Korea
2.8%
HEARING DISABILITY
95.9/ 100
METRIC RATING
95th/ 347
METRIC RANK
2.7%
HEARING DISABILITY
97.5/ 100
METRIC RATING
74th/ 347
METRIC RANK
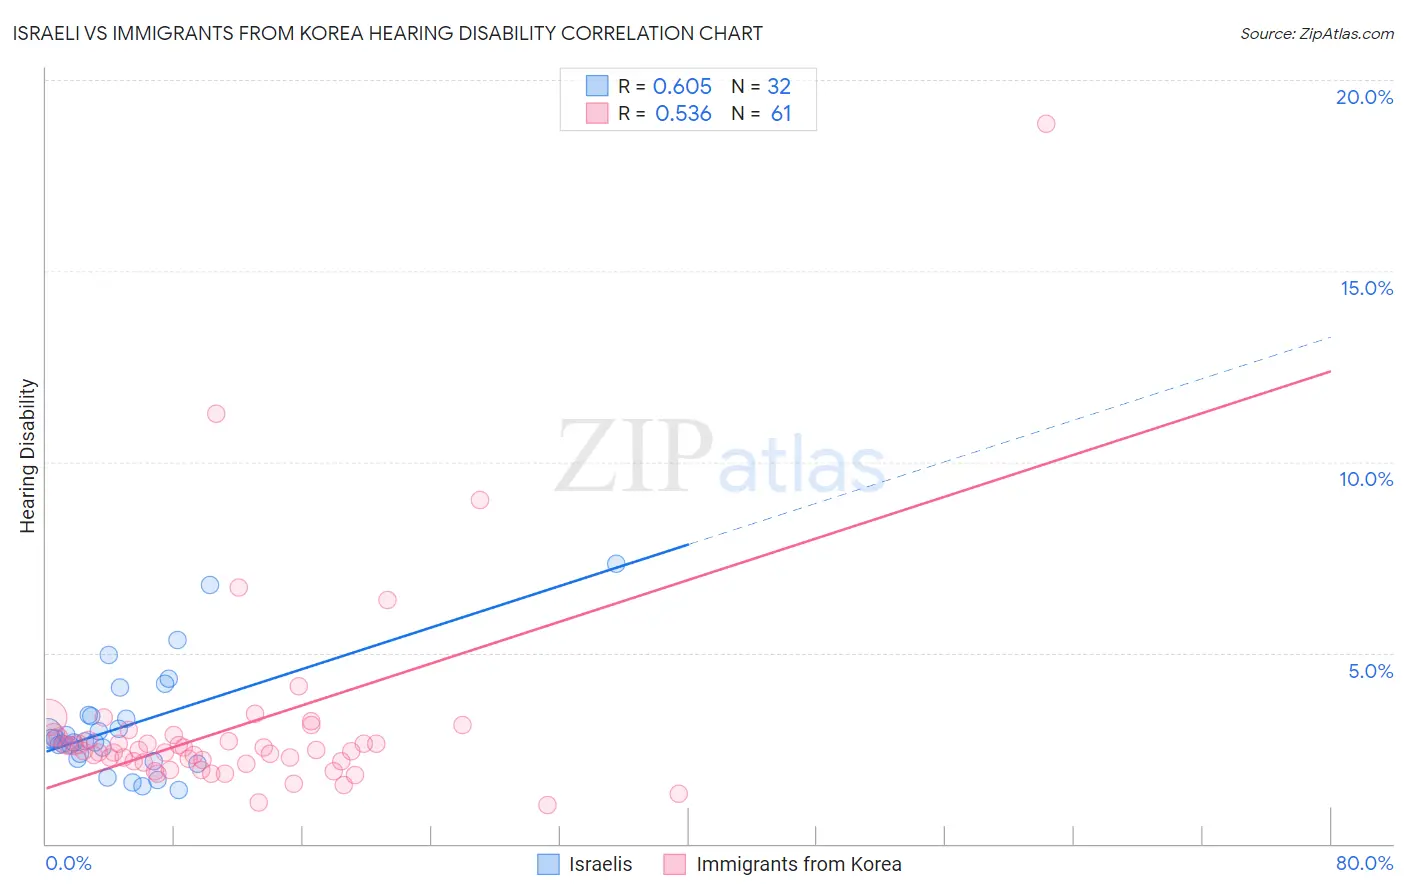
Israeli vs Immigrants from Korea Hearing Disability Correlation Chart
The statistical analysis conducted on geographies consisting of 211,123,306 people shows a significant positive correlation between the proportion of Israelis and percentage of population with hearing disability in the United States with a correlation coefficient (R) of 0.605 and weighted average of 2.8%. Similarly, the statistical analysis conducted on geographies consisting of 416,138,137 people shows a substantial positive correlation between the proportion of Immigrants from Korea and percentage of population with hearing disability in the United States with a correlation coefficient (R) of 0.536 and weighted average of 2.7%, a difference of 1.4%.
Hearing Disability Correlation Summary
| Measurement | Israeli | Immigrants from Korea |
| Minimum | 1.4% | 1.0% |
| Maximum | 7.3% | 18.9% |
| Range | 5.9% | 17.8% |
| Mean | 3.1% | 3.1% |
| Median | 2.7% | 2.5% |
| Interquartile 25% (IQ1) | 2.3% | 2.1% |
| Interquartile 75% (IQ3) | 3.4% | 2.8% |
| Interquartile Range (IQR) | 1.1% | 0.67% |
| Standard Deviation (Sample) | 1.4% | 2.6% |
| Standard Deviation (Population) | 1.4% | 2.6% |
Similar Demographics by Hearing Disability
Demographics Similar to Israelis by Hearing Disability
In terms of hearing disability, the demographic groups most similar to Israelis are Uruguayan (2.8%, a difference of 0.020%), Immigrants from Somalia (2.8%, a difference of 0.19%), Immigrants from Kuwait (2.8%, a difference of 0.29%), Immigrants from Afghanistan (2.8%, a difference of 0.36%), and Iranian (2.8%, a difference of 0.41%).
| Demographics | Rating | Rank | Hearing Disability |
| Immigrants | Turkey | 96.7 /100 | #88 | Exceptional 2.8% |
| Belizeans | 96.6 /100 | #89 | Exceptional 2.8% |
| Immigrants | Morocco | 96.6 /100 | #90 | Exceptional 2.8% |
| Immigrants | Middle Africa | 96.5 /100 | #91 | Exceptional 2.8% |
| Iranians | 96.4 /100 | #92 | Exceptional 2.8% |
| Immigrants | Kuwait | 96.3 /100 | #93 | Exceptional 2.8% |
| Uruguayans | 95.9 /100 | #94 | Exceptional 2.8% |
| Israelis | 95.9 /100 | #95 | Exceptional 2.8% |
| Immigrants | Somalia | 95.5 /100 | #96 | Exceptional 2.8% |
| Immigrants | Afghanistan | 95.3 /100 | #97 | Exceptional 2.8% |
| Immigrants | Honduras | 95.1 /100 | #98 | Exceptional 2.8% |
| Immigrants | Guatemala | 95.1 /100 | #99 | Exceptional 2.8% |
| Immigrants | Eastern Africa | 95.0 /100 | #100 | Exceptional 2.8% |
| Immigrants | Spain | 94.9 /100 | #101 | Exceptional 2.8% |
| Taiwanese | 94.8 /100 | #102 | Exceptional 2.8% |
Demographics Similar to Immigrants from Korea by Hearing Disability
In terms of hearing disability, the demographic groups most similar to Immigrants from Korea are Argentinean (2.7%, a difference of 0.0%), Immigrants from Saudi Arabia (2.7%, a difference of 0.030%), Asian (2.7%, a difference of 0.030%), Immigrants from Malaysia (2.7%, a difference of 0.050%), and Afghan (2.7%, a difference of 0.080%).
| Demographics | Rating | Rank | Hearing Disability |
| Egyptians | 98.1 /100 | #67 | Exceptional 2.7% |
| Immigrants | Africa | 98.0 /100 | #68 | Exceptional 2.7% |
| Nicaraguans | 97.9 /100 | #69 | Exceptional 2.7% |
| Peruvians | 97.7 /100 | #70 | Exceptional 2.7% |
| Central Americans | 97.7 /100 | #71 | Exceptional 2.7% |
| Afghans | 97.6 /100 | #72 | Exceptional 2.7% |
| Argentineans | 97.5 /100 | #73 | Exceptional 2.7% |
| Immigrants | Korea | 97.5 /100 | #74 | Exceptional 2.7% |
| Immigrants | Saudi Arabia | 97.5 /100 | #75 | Exceptional 2.7% |
| Asians | 97.5 /100 | #76 | Exceptional 2.7% |
| Immigrants | Malaysia | 97.5 /100 | #77 | Exceptional 2.7% |
| Mongolians | 97.4 /100 | #78 | Exceptional 2.7% |
| Colombians | 97.4 /100 | #79 | Exceptional 2.7% |
| Immigrants | Asia | 97.2 /100 | #80 | Exceptional 2.7% |
| Immigrants | Uruguay | 97.2 /100 | #81 | Exceptional 2.7% |