New Zealander vs Immigrants from Cabo Verde Male Disability
COMPARE
New Zealander
Immigrants from Cabo Verde
Male Disability
Male Disability Comparison
New Zealanders
Immigrants from Cabo Verde
11.2%
MALE DISABILITY
52.9/ 100
METRIC RATING
170th/ 347
METRIC RANK
12.8%
MALE DISABILITY
0.0/ 100
METRIC RATING
289th/ 347
METRIC RANK
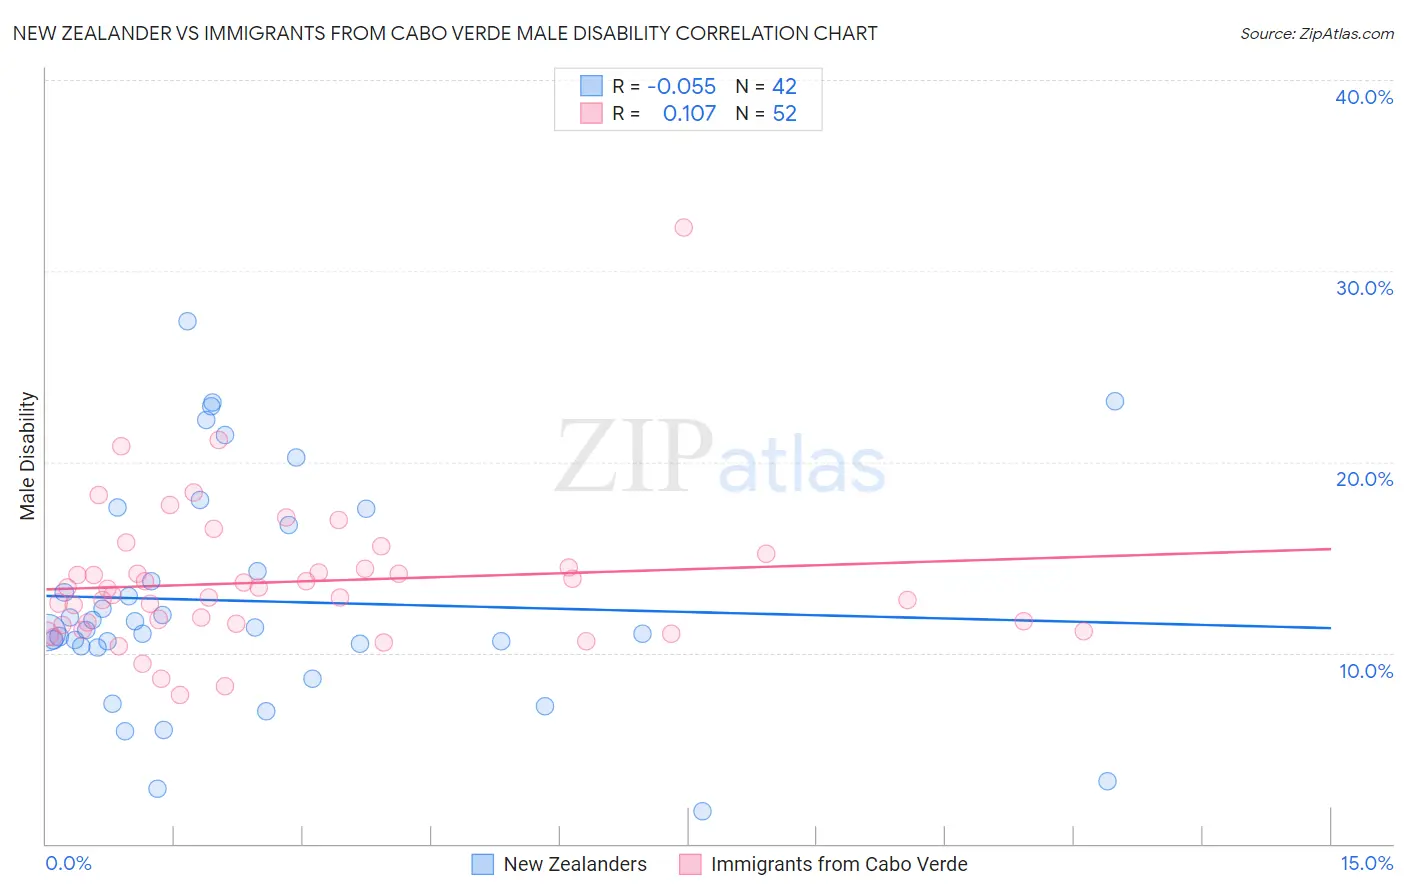
New Zealander vs Immigrants from Cabo Verde Male Disability Correlation Chart
The statistical analysis conducted on geographies consisting of 106,918,286 people shows a slight negative correlation between the proportion of New Zealanders and percentage of males with a disability in the United States with a correlation coefficient (R) of -0.055 and weighted average of 11.2%. Similarly, the statistical analysis conducted on geographies consisting of 38,149,674 people shows a poor positive correlation between the proportion of Immigrants from Cabo Verde and percentage of males with a disability in the United States with a correlation coefficient (R) of 0.107 and weighted average of 12.8%, a difference of 14.4%.
Male Disability Correlation Summary
| Measurement | New Zealander | Immigrants from Cabo Verde |
| Minimum | 1.7% | 7.8% |
| Maximum | 27.4% | 32.3% |
| Range | 25.7% | 24.5% |
| Mean | 12.7% | 13.7% |
| Median | 11.3% | 13.2% |
| Interquartile 25% (IQ1) | 10.4% | 11.5% |
| Interquartile 75% (IQ3) | 16.7% | 14.4% |
| Interquartile Range (IQR) | 6.3% | 3.0% |
| Standard Deviation (Sample) | 5.9% | 3.9% |
| Standard Deviation (Population) | 5.8% | 3.8% |
Similar Demographics by Male Disability
Demographics Similar to New Zealanders by Male Disability
In terms of male disability, the demographic groups most similar to New Zealanders are Haitian (11.2%, a difference of 0.020%), Barbadian (11.2%, a difference of 0.030%), Immigrants from Latin America (11.2%, a difference of 0.060%), Immigrants from Southern Europe (11.2%, a difference of 0.080%), and Romanian (11.2%, a difference of 0.12%).
| Demographics | Rating | Rank | Male Disability |
| Immigrants | Kenya | 63.8 /100 | #163 | Good 11.1% |
| British West Indians | 62.8 /100 | #164 | Good 11.1% |
| Luxembourgers | 61.9 /100 | #165 | Good 11.1% |
| Immigrants | Hungary | 61.2 /100 | #166 | Good 11.1% |
| Immigrants | Southern Europe | 54.4 /100 | #167 | Average 11.2% |
| Immigrants | Latin America | 54.0 /100 | #168 | Average 11.2% |
| Barbadians | 53.4 /100 | #169 | Average 11.2% |
| New Zealanders | 52.9 /100 | #170 | Average 11.2% |
| Haitians | 52.5 /100 | #171 | Average 11.2% |
| Romanians | 50.7 /100 | #172 | Average 11.2% |
| Immigrants | Burma/Myanmar | 50.4 /100 | #173 | Average 11.2% |
| Maltese | 50.0 /100 | #174 | Average 11.2% |
| Immigrants | Honduras | 48.7 /100 | #175 | Average 11.2% |
| Syrians | 46.6 /100 | #176 | Average 11.2% |
| Immigrants | Norway | 44.2 /100 | #177 | Average 11.3% |
Demographics Similar to Immigrants from Cabo Verde by Male Disability
In terms of male disability, the demographic groups most similar to Immigrants from Cabo Verde are Pima (12.8%, a difference of 0.15%), Yup'ik (12.8%, a difference of 0.19%), White/Caucasian (12.8%, a difference of 0.24%), English (12.8%, a difference of 0.30%), and Cape Verdean (12.8%, a difference of 0.38%).
| Demographics | Rating | Rank | Male Disability |
| Irish | 0.0 /100 | #282 | Tragic 12.7% |
| Germans | 0.0 /100 | #283 | Tragic 12.7% |
| Spanish | 0.0 /100 | #284 | Tragic 12.7% |
| Welsh | 0.0 /100 | #285 | Tragic 12.7% |
| Scottish | 0.0 /100 | #286 | Tragic 12.8% |
| Cape Verdeans | 0.0 /100 | #287 | Tragic 12.8% |
| Yup'ik | 0.0 /100 | #288 | Tragic 12.8% |
| Immigrants | Cabo Verde | 0.0 /100 | #289 | Tragic 12.8% |
| Pima | 0.0 /100 | #290 | Tragic 12.8% |
| Whites/Caucasians | 0.0 /100 | #291 | Tragic 12.8% |
| English | 0.0 /100 | #292 | Tragic 12.8% |
| Yaqui | 0.0 /100 | #293 | Tragic 12.9% |
| Marshallese | 0.0 /100 | #294 | Tragic 12.9% |
| Immigrants | Micronesia | 0.0 /100 | #295 | Tragic 12.9% |
| Immigrants | Nonimmigrants | 0.0 /100 | #296 | Tragic 12.9% |