New Zealander vs Immigrants from Laos Male Disability
COMPARE
New Zealander
Immigrants from Laos
Male Disability
Male Disability Comparison
New Zealanders
Immigrants from Laos
11.2%
MALE DISABILITY
52.9/ 100
METRIC RATING
170th/ 347
METRIC RANK
11.9%
MALE DISABILITY
1.0/ 100
METRIC RATING
244th/ 347
METRIC RANK
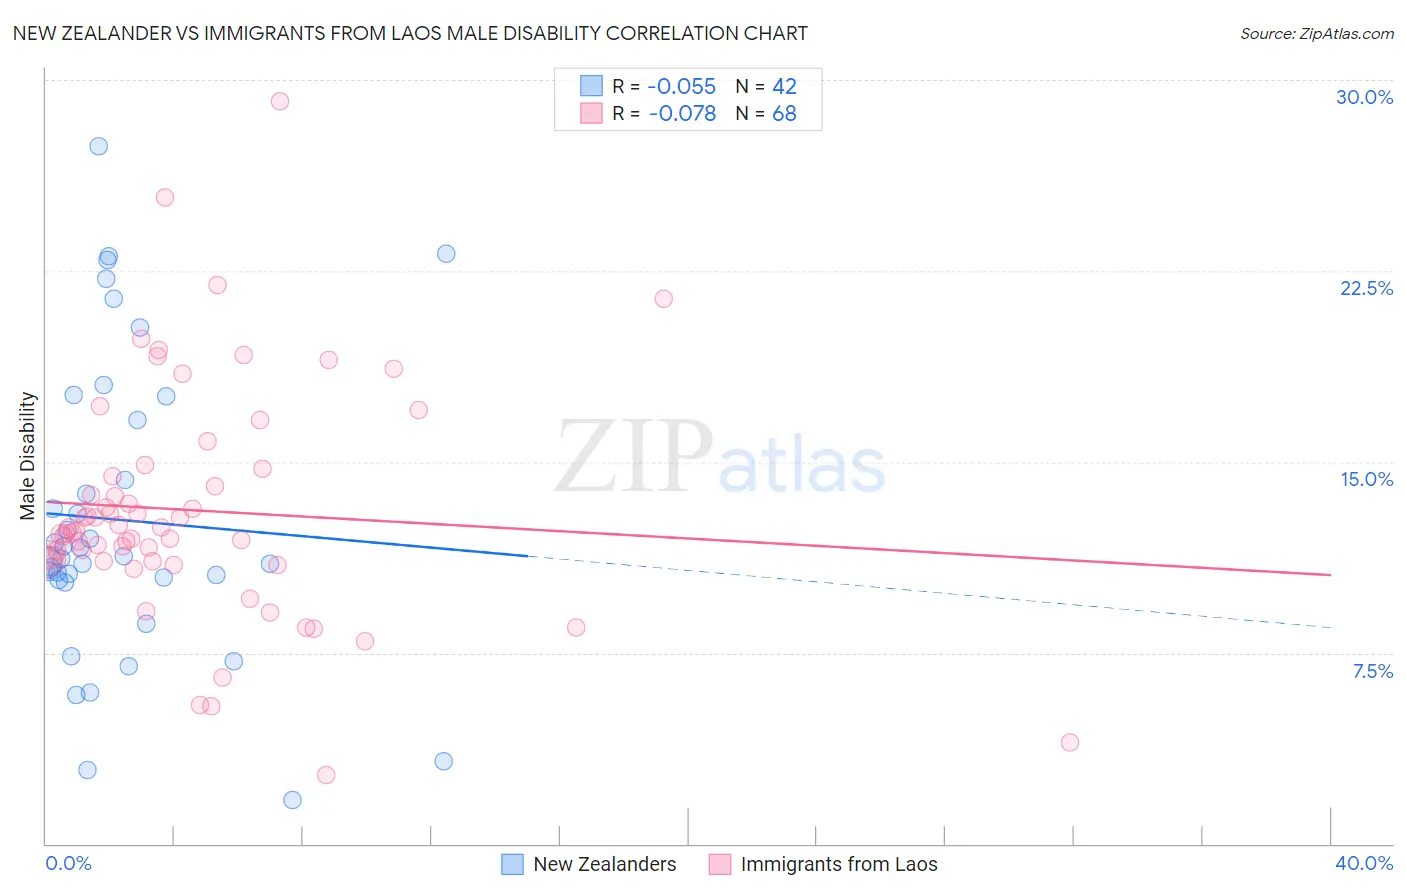
New Zealander vs Immigrants from Laos Male Disability Correlation Chart
The statistical analysis conducted on geographies consisting of 106,918,286 people shows a slight negative correlation between the proportion of New Zealanders and percentage of males with a disability in the United States with a correlation coefficient (R) of -0.055 and weighted average of 11.2%. Similarly, the statistical analysis conducted on geographies consisting of 201,462,154 people shows a slight negative correlation between the proportion of Immigrants from Laos and percentage of males with a disability in the United States with a correlation coefficient (R) of -0.078 and weighted average of 11.9%, a difference of 6.6%.
Male Disability Correlation Summary
| Measurement | New Zealander | Immigrants from Laos |
| Minimum | 1.7% | 2.7% |
| Maximum | 27.4% | 29.2% |
| Range | 25.7% | 26.5% |
| Mean | 12.7% | 13.1% |
| Median | 11.3% | 12.2% |
| Interquartile 25% (IQ1) | 10.4% | 11.1% |
| Interquartile 75% (IQ3) | 16.7% | 14.6% |
| Interquartile Range (IQR) | 6.3% | 3.5% |
| Standard Deviation (Sample) | 5.9% | 4.6% |
| Standard Deviation (Population) | 5.8% | 4.6% |
Similar Demographics by Male Disability
Demographics Similar to New Zealanders by Male Disability
In terms of male disability, the demographic groups most similar to New Zealanders are Haitian (11.2%, a difference of 0.020%), Barbadian (11.2%, a difference of 0.030%), Immigrants from Latin America (11.2%, a difference of 0.060%), Immigrants from Southern Europe (11.2%, a difference of 0.080%), and Romanian (11.2%, a difference of 0.12%).
| Demographics | Rating | Rank | Male Disability |
| Immigrants | Kenya | 63.8 /100 | #163 | Good 11.1% |
| British West Indians | 62.8 /100 | #164 | Good 11.1% |
| Luxembourgers | 61.9 /100 | #165 | Good 11.1% |
| Immigrants | Hungary | 61.2 /100 | #166 | Good 11.1% |
| Immigrants | Southern Europe | 54.4 /100 | #167 | Average 11.2% |
| Immigrants | Latin America | 54.0 /100 | #168 | Average 11.2% |
| Barbadians | 53.4 /100 | #169 | Average 11.2% |
| New Zealanders | 52.9 /100 | #170 | Average 11.2% |
| Haitians | 52.5 /100 | #171 | Average 11.2% |
| Romanians | 50.7 /100 | #172 | Average 11.2% |
| Immigrants | Burma/Myanmar | 50.4 /100 | #173 | Average 11.2% |
| Maltese | 50.0 /100 | #174 | Average 11.2% |
| Immigrants | Honduras | 48.7 /100 | #175 | Average 11.2% |
| Syrians | 46.6 /100 | #176 | Average 11.2% |
| Immigrants | Norway | 44.2 /100 | #177 | Average 11.3% |
Demographics Similar to Immigrants from Laos by Male Disability
In terms of male disability, the demographic groups most similar to Immigrants from Laos are Immigrants from Liberia (11.9%, a difference of 0.0%), Danish (11.9%, a difference of 0.040%), Samoan (11.9%, a difference of 0.11%), Northern European (11.9%, a difference of 0.14%), and Bahamian (11.9%, a difference of 0.16%).
| Demographics | Rating | Rank | Male Disability |
| Carpatho Rusyns | 1.3 /100 | #237 | Tragic 11.9% |
| Yugoslavians | 1.2 /100 | #238 | Tragic 11.9% |
| Italians | 1.2 /100 | #239 | Tragic 11.9% |
| Czechs | 1.1 /100 | #240 | Tragic 11.9% |
| Bahamians | 1.1 /100 | #241 | Tragic 11.9% |
| Northern Europeans | 1.1 /100 | #242 | Tragic 11.9% |
| Samoans | 1.1 /100 | #243 | Tragic 11.9% |
| Immigrants | Laos | 1.0 /100 | #244 | Tragic 11.9% |
| Immigrants | Liberia | 1.0 /100 | #245 | Tragic 11.9% |
| Danes | 0.9 /100 | #246 | Tragic 11.9% |
| Hungarians | 0.8 /100 | #247 | Tragic 12.0% |
| Poles | 0.7 /100 | #248 | Tragic 12.0% |
| Immigrants | Yemen | 0.5 /100 | #249 | Tragic 12.0% |
| Bangladeshis | 0.5 /100 | #250 | Tragic 12.0% |
| German Russians | 0.5 /100 | #251 | Tragic 12.0% |