New Zealander vs Immigrants from Denmark Male Disability
COMPARE
New Zealander
Immigrants from Denmark
Male Disability
Male Disability Comparison
New Zealanders
Immigrants from Denmark
11.2%
MALE DISABILITY
52.9/ 100
METRIC RATING
170th/ 347
METRIC RANK
11.0%
MALE DISABILITY
76.4/ 100
METRIC RATING
149th/ 347
METRIC RANK
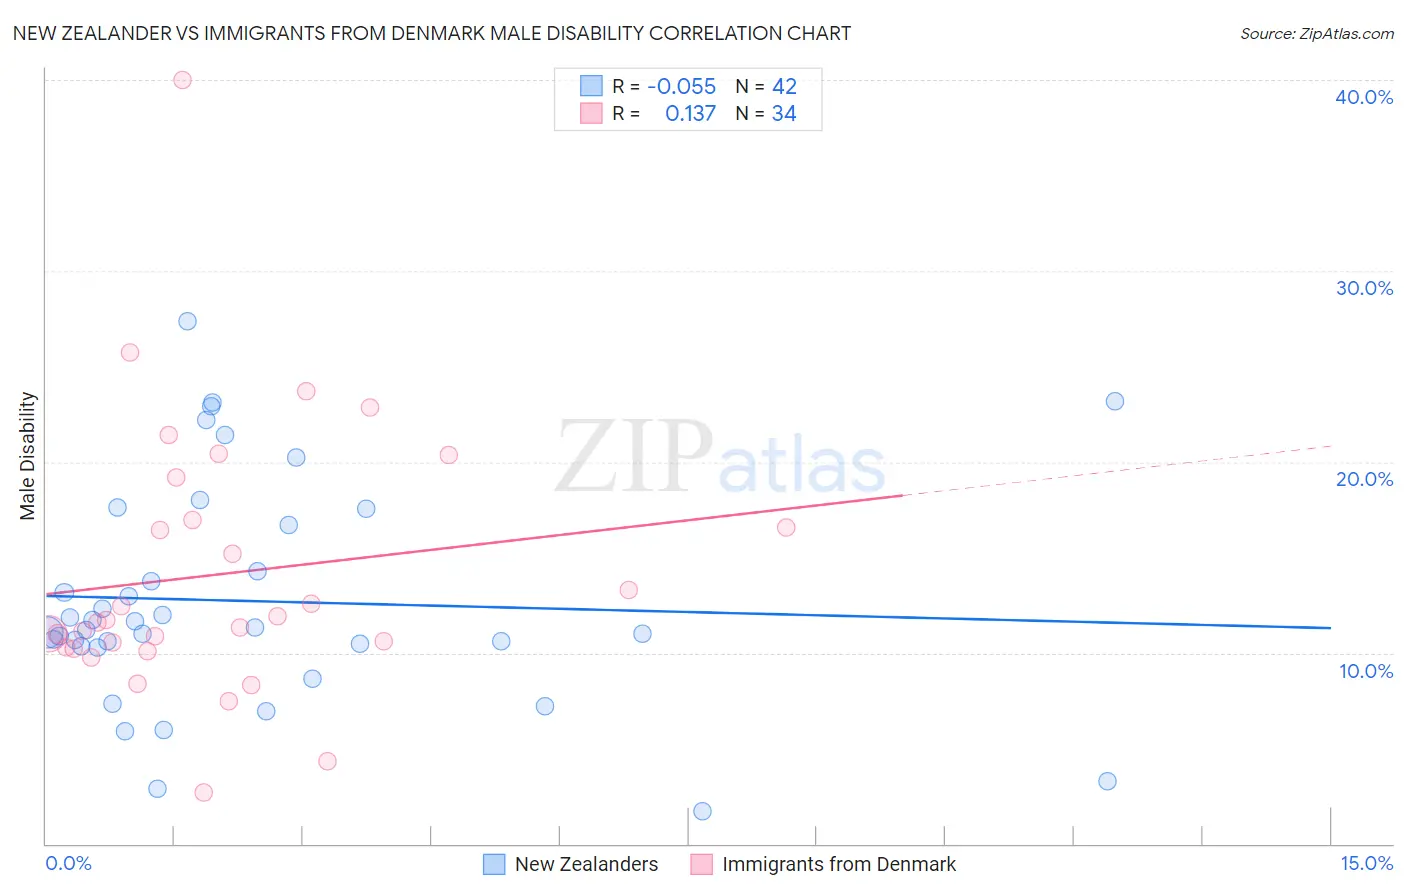
New Zealander vs Immigrants from Denmark Male Disability Correlation Chart
The statistical analysis conducted on geographies consisting of 106,918,286 people shows a slight negative correlation between the proportion of New Zealanders and percentage of males with a disability in the United States with a correlation coefficient (R) of -0.055 and weighted average of 11.2%. Similarly, the statistical analysis conducted on geographies consisting of 136,428,328 people shows a poor positive correlation between the proportion of Immigrants from Denmark and percentage of males with a disability in the United States with a correlation coefficient (R) of 0.137 and weighted average of 11.0%, a difference of 1.5%.
Male Disability Correlation Summary
| Measurement | New Zealander | Immigrants from Denmark |
| Minimum | 1.7% | 2.7% |
| Maximum | 27.4% | 40.0% |
| Range | 25.7% | 37.3% |
| Mean | 12.7% | 14.1% |
| Median | 11.3% | 11.7% |
| Interquartile 25% (IQ1) | 10.4% | 10.3% |
| Interquartile 75% (IQ3) | 16.7% | 17.0% |
| Interquartile Range (IQR) | 6.3% | 6.7% |
| Standard Deviation (Sample) | 5.9% | 7.1% |
| Standard Deviation (Population) | 5.8% | 7.0% |
Similar Demographics by Male Disability
Demographics Similar to New Zealanders by Male Disability
In terms of male disability, the demographic groups most similar to New Zealanders are Haitian (11.2%, a difference of 0.020%), Barbadian (11.2%, a difference of 0.030%), Immigrants from Latin America (11.2%, a difference of 0.060%), Immigrants from Southern Europe (11.2%, a difference of 0.080%), and Romanian (11.2%, a difference of 0.12%).
| Demographics | Rating | Rank | Male Disability |
| Immigrants | Kenya | 63.8 /100 | #163 | Good 11.1% |
| British West Indians | 62.8 /100 | #164 | Good 11.1% |
| Luxembourgers | 61.9 /100 | #165 | Good 11.1% |
| Immigrants | Hungary | 61.2 /100 | #166 | Good 11.1% |
| Immigrants | Southern Europe | 54.4 /100 | #167 | Average 11.2% |
| Immigrants | Latin America | 54.0 /100 | #168 | Average 11.2% |
| Barbadians | 53.4 /100 | #169 | Average 11.2% |
| New Zealanders | 52.9 /100 | #170 | Average 11.2% |
| Haitians | 52.5 /100 | #171 | Average 11.2% |
| Romanians | 50.7 /100 | #172 | Average 11.2% |
| Immigrants | Burma/Myanmar | 50.4 /100 | #173 | Average 11.2% |
| Maltese | 50.0 /100 | #174 | Average 11.2% |
| Immigrants | Honduras | 48.7 /100 | #175 | Average 11.2% |
| Syrians | 46.6 /100 | #176 | Average 11.2% |
| Immigrants | Norway | 44.2 /100 | #177 | Average 11.3% |
Demographics Similar to Immigrants from Denmark by Male Disability
In terms of male disability, the demographic groups most similar to Immigrants from Denmark are Sudanese (11.0%, a difference of 0.060%), Immigrants from Croatia (11.0%, a difference of 0.070%), Korean (11.0%, a difference of 0.090%), Immigrants from Guatemala (11.0%, a difference of 0.10%), and Cuban (11.0%, a difference of 0.12%).
| Demographics | Rating | Rank | Male Disability |
| Immigrants | Sudan | 81.5 /100 | #142 | Excellent 11.0% |
| Moroccans | 80.7 /100 | #143 | Excellent 11.0% |
| Kenyans | 78.1 /100 | #144 | Good 11.0% |
| Costa Ricans | 78.0 /100 | #145 | Good 11.0% |
| Koreans | 77.5 /100 | #146 | Good 11.0% |
| Immigrants | Croatia | 77.3 /100 | #147 | Good 11.0% |
| Sudanese | 77.1 /100 | #148 | Good 11.0% |
| Immigrants | Denmark | 76.4 /100 | #149 | Good 11.0% |
| Immigrants | Guatemala | 75.1 /100 | #150 | Good 11.0% |
| Cubans | 74.9 /100 | #151 | Good 11.0% |
| Immigrants | Albania | 74.4 /100 | #152 | Good 11.0% |
| Immigrants | Northern Europe | 73.2 /100 | #153 | Good 11.1% |
| Immigrants | Moldova | 72.8 /100 | #154 | Good 11.1% |
| Immigrants | Middle Africa | 70.9 /100 | #155 | Good 11.1% |
| Russians | 69.8 /100 | #156 | Good 11.1% |