New Zealander vs Immigrants from Asia Male Disability
COMPARE
New Zealander
Immigrants from Asia
Male Disability
Male Disability Comparison
New Zealanders
Immigrants from Asia
11.2%
MALE DISABILITY
52.9/ 100
METRIC RATING
170th/ 347
METRIC RANK
10.0%
MALE DISABILITY
100.0/ 100
METRIC RATING
24th/ 347
METRIC RANK
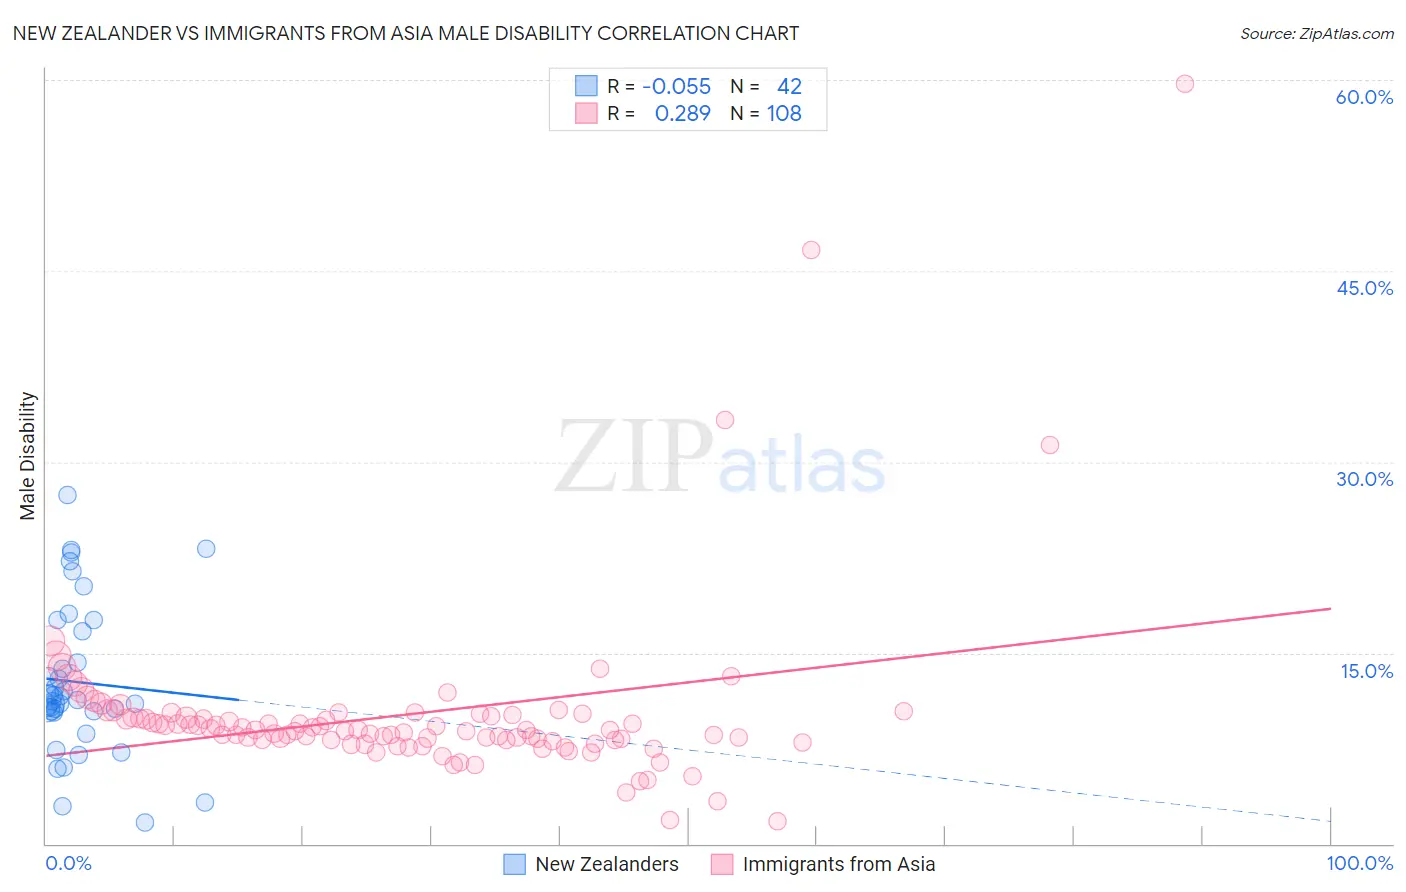
New Zealander vs Immigrants from Asia Male Disability Correlation Chart
The statistical analysis conducted on geographies consisting of 106,918,286 people shows a slight negative correlation between the proportion of New Zealanders and percentage of males with a disability in the United States with a correlation coefficient (R) of -0.055 and weighted average of 11.2%. Similarly, the statistical analysis conducted on geographies consisting of 548,953,248 people shows a weak positive correlation between the proportion of Immigrants from Asia and percentage of males with a disability in the United States with a correlation coefficient (R) of 0.289 and weighted average of 10.0%, a difference of 11.7%.
Male Disability Correlation Summary
| Measurement | New Zealander | Immigrants from Asia |
| Minimum | 1.7% | 1.8% |
| Maximum | 27.4% | 59.7% |
| Range | 25.7% | 57.9% |
| Mean | 12.7% | 10.2% |
| Median | 11.3% | 8.9% |
| Interquartile 25% (IQ1) | 10.4% | 8.1% |
| Interquartile 75% (IQ3) | 16.7% | 10.1% |
| Interquartile Range (IQR) | 6.3% | 1.9% |
| Standard Deviation (Sample) | 5.9% | 7.1% |
| Standard Deviation (Population) | 5.8% | 7.1% |
Similar Demographics by Male Disability
Demographics Similar to New Zealanders by Male Disability
In terms of male disability, the demographic groups most similar to New Zealanders are Haitian (11.2%, a difference of 0.020%), Barbadian (11.2%, a difference of 0.030%), Immigrants from Latin America (11.2%, a difference of 0.060%), Immigrants from Southern Europe (11.2%, a difference of 0.080%), and Romanian (11.2%, a difference of 0.12%).
| Demographics | Rating | Rank | Male Disability |
| Immigrants | Kenya | 63.8 /100 | #163 | Good 11.1% |
| British West Indians | 62.8 /100 | #164 | Good 11.1% |
| Luxembourgers | 61.9 /100 | #165 | Good 11.1% |
| Immigrants | Hungary | 61.2 /100 | #166 | Good 11.1% |
| Immigrants | Southern Europe | 54.4 /100 | #167 | Average 11.2% |
| Immigrants | Latin America | 54.0 /100 | #168 | Average 11.2% |
| Barbadians | 53.4 /100 | #169 | Average 11.2% |
| New Zealanders | 52.9 /100 | #170 | Average 11.2% |
| Haitians | 52.5 /100 | #171 | Average 11.2% |
| Romanians | 50.7 /100 | #172 | Average 11.2% |
| Immigrants | Burma/Myanmar | 50.4 /100 | #173 | Average 11.2% |
| Maltese | 50.0 /100 | #174 | Average 11.2% |
| Immigrants | Honduras | 48.7 /100 | #175 | Average 11.2% |
| Syrians | 46.6 /100 | #176 | Average 11.2% |
| Immigrants | Norway | 44.2 /100 | #177 | Average 11.3% |
Demographics Similar to Immigrants from Asia by Male Disability
In terms of male disability, the demographic groups most similar to Immigrants from Asia are Cypriot (10.0%, a difference of 0.14%), Immigrants from Malaysia (10.0%, a difference of 0.19%), Immigrants from Venezuela (10.0%, a difference of 0.23%), Paraguayan (10.1%, a difference of 0.32%), and Burmese (10.0%, a difference of 0.51%).
| Demographics | Rating | Rank | Male Disability |
| Immigrants | Korea | 100.0 /100 | #17 | Exceptional 9.8% |
| Immigrants | Pakistan | 100.0 /100 | #18 | Exceptional 9.8% |
| Immigrants | Sri Lanka | 100.0 /100 | #19 | Exceptional 10.0% |
| Asians | 100.0 /100 | #20 | Exceptional 10.0% |
| Burmese | 100.0 /100 | #21 | Exceptional 10.0% |
| Immigrants | Venezuela | 100.0 /100 | #22 | Exceptional 10.0% |
| Cypriots | 100.0 /100 | #23 | Exceptional 10.0% |
| Immigrants | Asia | 100.0 /100 | #24 | Exceptional 10.0% |
| Immigrants | Malaysia | 99.9 /100 | #25 | Exceptional 10.0% |
| Paraguayans | 99.9 /100 | #26 | Exceptional 10.1% |
| Egyptians | 99.9 /100 | #27 | Exceptional 10.1% |
| Vietnamese | 99.9 /100 | #28 | Exceptional 10.1% |
| Venezuelans | 99.9 /100 | #29 | Exceptional 10.1% |
| Immigrants | Egypt | 99.9 /100 | #30 | Exceptional 10.1% |
| Soviet Union | 99.9 /100 | #31 | Exceptional 10.1% |