Bermudan vs Canadian Hearing Disability
COMPARE
Bermudan
Canadian
Hearing Disability
Hearing Disability Comparison
Bermudans
Canadians
2.9%
HEARING DISABILITY
83.8/ 100
METRIC RATING
139th/ 347
METRIC RANK
3.5%
HEARING DISABILITY
0.1/ 100
METRIC RATING
267th/ 347
METRIC RANK
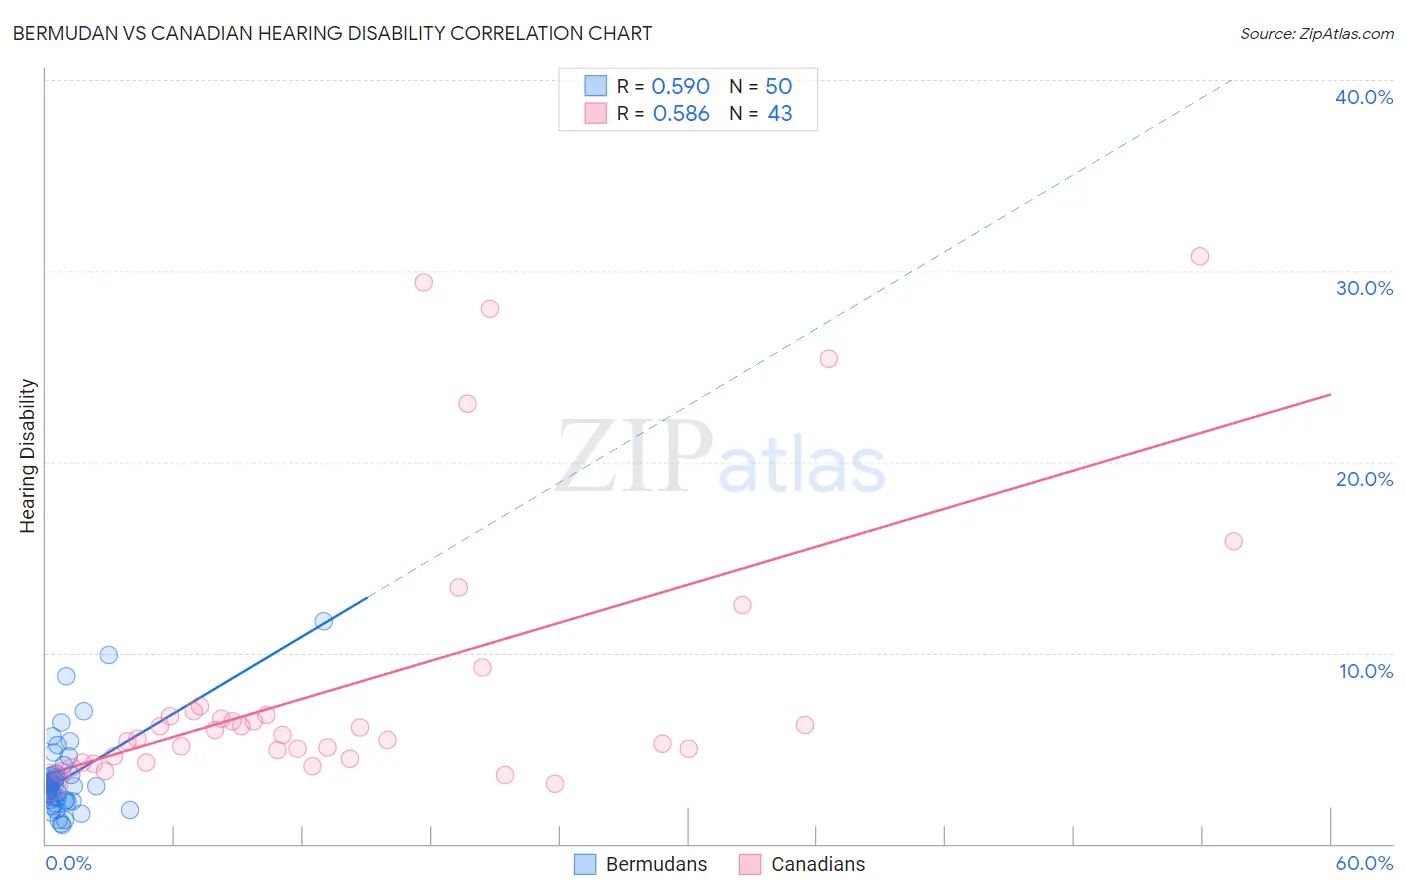
Bermudan vs Canadian Hearing Disability Correlation Chart
The statistical analysis conducted on geographies consisting of 55,720,149 people shows a substantial positive correlation between the proportion of Bermudans and percentage of population with hearing disability in the United States with a correlation coefficient (R) of 0.590 and weighted average of 2.9%. Similarly, the statistical analysis conducted on geographies consisting of 437,359,383 people shows a substantial positive correlation between the proportion of Canadians and percentage of population with hearing disability in the United States with a correlation coefficient (R) of 0.586 and weighted average of 3.5%, a difference of 21.1%.
Hearing Disability Correlation Summary
| Measurement | Bermudan | Canadian |
| Minimum | 0.95% | 3.1% |
| Maximum | 11.7% | 30.8% |
| Range | 10.7% | 27.6% |
| Mean | 3.5% | 8.5% |
| Median | 3.0% | 5.7% |
| Interquartile 25% (IQ1) | 2.2% | 4.4% |
| Interquartile 75% (IQ3) | 3.6% | 6.9% |
| Interquartile Range (IQR) | 1.4% | 2.5% |
| Standard Deviation (Sample) | 2.1% | 7.4% |
| Standard Deviation (Population) | 2.1% | 7.3% |
Similar Demographics by Hearing Disability
Demographics Similar to Bermudans by Hearing Disability
In terms of hearing disability, the demographic groups most similar to Bermudans are Immigrants from Jordan (2.9%, a difference of 0.020%), Sri Lankan (2.9%, a difference of 0.050%), Immigrants from Costa Rica (2.9%, a difference of 0.050%), Subsaharan African (2.9%, a difference of 0.090%), and Immigrants from Brazil (2.9%, a difference of 0.15%).
| Demographics | Rating | Rank | Hearing Disability |
| Chileans | 85.8 /100 | #132 | Excellent 2.9% |
| Immigrants | Syria | 85.8 /100 | #133 | Excellent 2.9% |
| Ugandans | 85.5 /100 | #134 | Excellent 2.9% |
| Soviet Union | 84.8 /100 | #135 | Excellent 2.9% |
| Immigrants | Brazil | 84.6 /100 | #136 | Excellent 2.9% |
| Sri Lankans | 84.1 /100 | #137 | Excellent 2.9% |
| Immigrants | Costa Rica | 84.0 /100 | #138 | Excellent 2.9% |
| Bermudans | 83.8 /100 | #139 | Excellent 2.9% |
| Immigrants | Jordan | 83.7 /100 | #140 | Excellent 2.9% |
| Sub-Saharan Africans | 83.3 /100 | #141 | Excellent 2.9% |
| Laotians | 81.1 /100 | #142 | Excellent 2.9% |
| Immigrants | Bahamas | 80.9 /100 | #143 | Excellent 2.9% |
| Immigrants | Bulgaria | 79.2 /100 | #144 | Good 2.9% |
| Immigrants | Congo | 78.9 /100 | #145 | Good 2.9% |
| Brazilians | 78.7 /100 | #146 | Good 2.9% |
Demographics Similar to Canadians by Hearing Disability
In terms of hearing disability, the demographic groups most similar to Canadians are Spaniard (3.5%, a difference of 0.020%), Belgian (3.5%, a difference of 0.22%), Ute (3.5%, a difference of 0.32%), British (3.5%, a difference of 0.40%), and Immigrants from Germany (3.5%, a difference of 0.42%).
| Demographics | Rating | Rank | Hearing Disability |
| Portuguese | 0.1 /100 | #260 | Tragic 3.5% |
| Hawaiians | 0.1 /100 | #261 | Tragic 3.5% |
| Immigrants | North America | 0.1 /100 | #262 | Tragic 3.5% |
| Immigrants | Canada | 0.1 /100 | #263 | Tragic 3.5% |
| Immigrants | Germany | 0.1 /100 | #264 | Tragic 3.5% |
| British | 0.1 /100 | #265 | Tragic 3.5% |
| Belgians | 0.1 /100 | #266 | Tragic 3.5% |
| Canadians | 0.1 /100 | #267 | Tragic 3.5% |
| Spaniards | 0.1 /100 | #268 | Tragic 3.5% |
| Ute | 0.1 /100 | #269 | Tragic 3.5% |
| Europeans | 0.1 /100 | #270 | Tragic 3.5% |
| Czechs | 0.1 /100 | #271 | Tragic 3.5% |
| Fijians | 0.0 /100 | #272 | Tragic 3.5% |
| Puerto Ricans | 0.0 /100 | #273 | Tragic 3.5% |
| Swiss | 0.0 /100 | #274 | Tragic 3.5% |