Immigrants from Belarus vs Canadian Hearing Disability
COMPARE
Immigrants from Belarus
Canadian
Hearing Disability
Hearing Disability Comparison
Immigrants from Belarus
Canadians
2.8%
HEARING DISABILITY
91.6/ 100
METRIC RATING
113th/ 347
METRIC RANK
3.5%
HEARING DISABILITY
0.1/ 100
METRIC RATING
267th/ 347
METRIC RANK
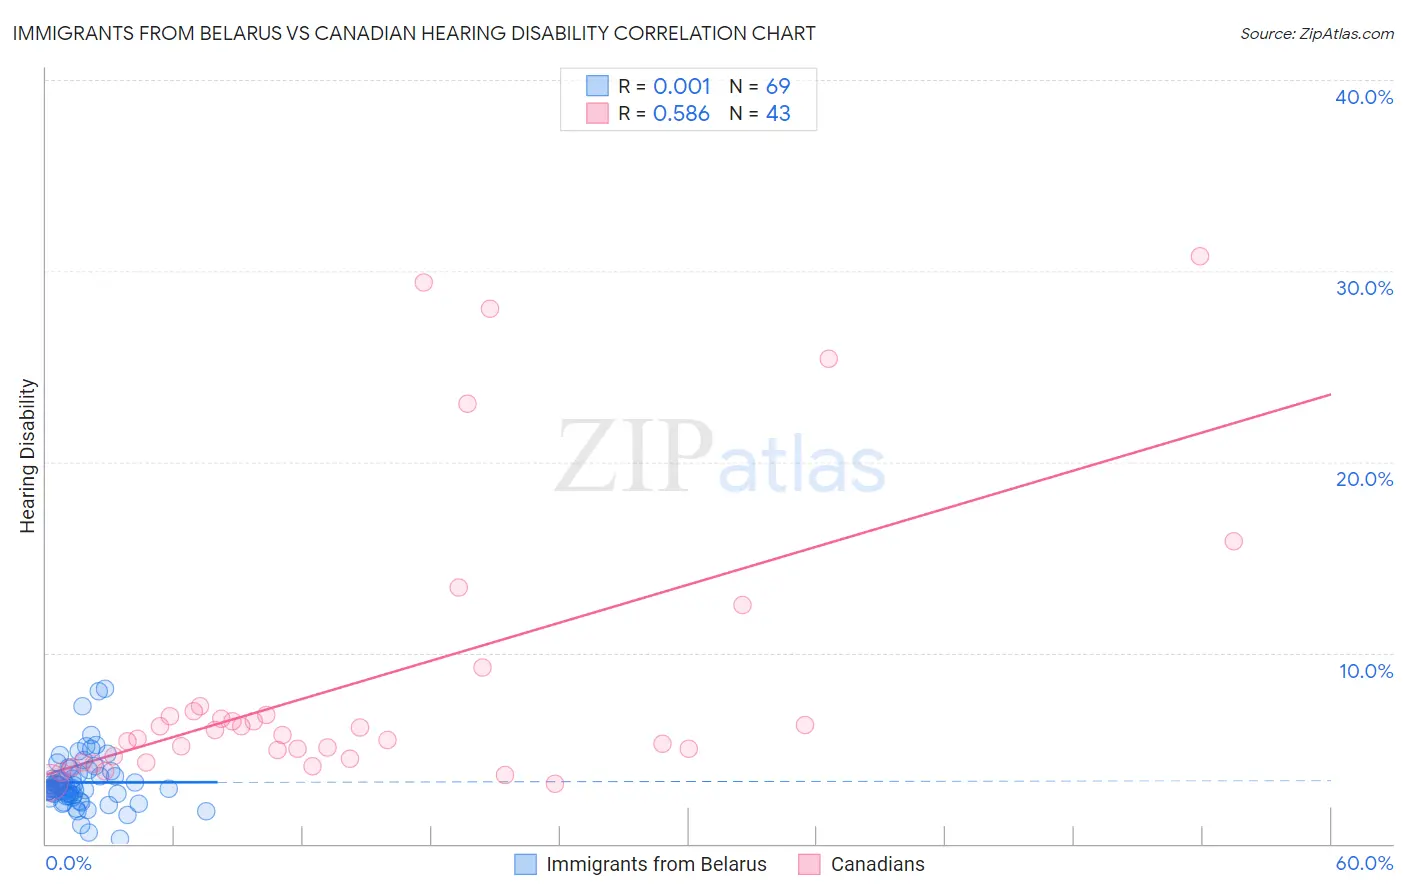
Immigrants from Belarus vs Canadian Hearing Disability Correlation Chart
The statistical analysis conducted on geographies consisting of 150,178,365 people shows no correlation between the proportion of Immigrants from Belarus and percentage of population with hearing disability in the United States with a correlation coefficient (R) of 0.001 and weighted average of 2.8%. Similarly, the statistical analysis conducted on geographies consisting of 437,359,383 people shows a substantial positive correlation between the proportion of Canadians and percentage of population with hearing disability in the United States with a correlation coefficient (R) of 0.586 and weighted average of 3.5%, a difference of 23.4%.
Hearing Disability Correlation Summary
| Measurement | Immigrants from Belarus | Canadian |
| Minimum | 0.28% | 3.1% |
| Maximum | 8.1% | 30.8% |
| Range | 7.9% | 27.6% |
| Mean | 3.2% | 8.5% |
| Median | 2.9% | 5.7% |
| Interquartile 25% (IQ1) | 2.5% | 4.4% |
| Interquartile 75% (IQ3) | 3.7% | 6.9% |
| Interquartile Range (IQR) | 1.2% | 2.5% |
| Standard Deviation (Sample) | 1.4% | 7.4% |
| Standard Deviation (Population) | 1.4% | 7.3% |
Similar Demographics by Hearing Disability
Demographics Similar to Immigrants from Belarus by Hearing Disability
In terms of hearing disability, the demographic groups most similar to Immigrants from Belarus are Cambodian (2.8%, a difference of 0.17%), U.S. Virgin Islander (2.8%, a difference of 0.31%), Immigrants from Latin America (2.8%, a difference of 0.34%), Immigrants from Yemen (2.8%, a difference of 0.39%), and Immigrants (2.8%, a difference of 0.41%).
| Demographics | Rating | Rank | Hearing Disability |
| Hondurans | 93.4 /100 | #106 | Exceptional 2.8% |
| Immigrants | Chile | 93.4 /100 | #107 | Exceptional 2.8% |
| Guatemalans | 93.2 /100 | #108 | Exceptional 2.8% |
| Turks | 93.0 /100 | #109 | Exceptional 2.8% |
| Cypriots | 92.9 /100 | #110 | Exceptional 2.8% |
| Immigrants | Yemen | 92.7 /100 | #111 | Exceptional 2.8% |
| U.S. Virgin Islanders | 92.5 /100 | #112 | Exceptional 2.8% |
| Immigrants | Belarus | 91.6 /100 | #113 | Exceptional 2.8% |
| Cambodians | 91.1 /100 | #114 | Exceptional 2.8% |
| Immigrants | Latin America | 90.5 /100 | #115 | Exceptional 2.8% |
| Immigrants | Immigrants | 90.3 /100 | #116 | Exceptional 2.8% |
| Immigrants | Liberia | 90.0 /100 | #117 | Excellent 2.8% |
| Zimbabweans | 89.9 /100 | #118 | Excellent 2.8% |
| Kenyans | 89.8 /100 | #119 | Excellent 2.8% |
| Jordanians | 89.5 /100 | #120 | Excellent 2.8% |
Demographics Similar to Canadians by Hearing Disability
In terms of hearing disability, the demographic groups most similar to Canadians are Spaniard (3.5%, a difference of 0.020%), Belgian (3.5%, a difference of 0.22%), Ute (3.5%, a difference of 0.32%), British (3.5%, a difference of 0.40%), and Immigrants from Germany (3.5%, a difference of 0.42%).
| Demographics | Rating | Rank | Hearing Disability |
| Portuguese | 0.1 /100 | #260 | Tragic 3.5% |
| Hawaiians | 0.1 /100 | #261 | Tragic 3.5% |
| Immigrants | North America | 0.1 /100 | #262 | Tragic 3.5% |
| Immigrants | Canada | 0.1 /100 | #263 | Tragic 3.5% |
| Immigrants | Germany | 0.1 /100 | #264 | Tragic 3.5% |
| British | 0.1 /100 | #265 | Tragic 3.5% |
| Belgians | 0.1 /100 | #266 | Tragic 3.5% |
| Canadians | 0.1 /100 | #267 | Tragic 3.5% |
| Spaniards | 0.1 /100 | #268 | Tragic 3.5% |
| Ute | 0.1 /100 | #269 | Tragic 3.5% |
| Europeans | 0.1 /100 | #270 | Tragic 3.5% |
| Czechs | 0.1 /100 | #271 | Tragic 3.5% |
| Fijians | 0.0 /100 | #272 | Tragic 3.5% |
| Puerto Ricans | 0.0 /100 | #273 | Tragic 3.5% |
| Swiss | 0.0 /100 | #274 | Tragic 3.5% |