Ute vs Bulgarian Hearing Disability
COMPARE
Ute
Bulgarian
Hearing Disability
Hearing Disability Comparison
Ute
Bulgarians
3.5%
HEARING DISABILITY
0.1/ 100
METRIC RATING
269th/ 347
METRIC RANK
3.0%
HEARING DISABILITY
39.7/ 100
METRIC RATING
183rd/ 347
METRIC RANK
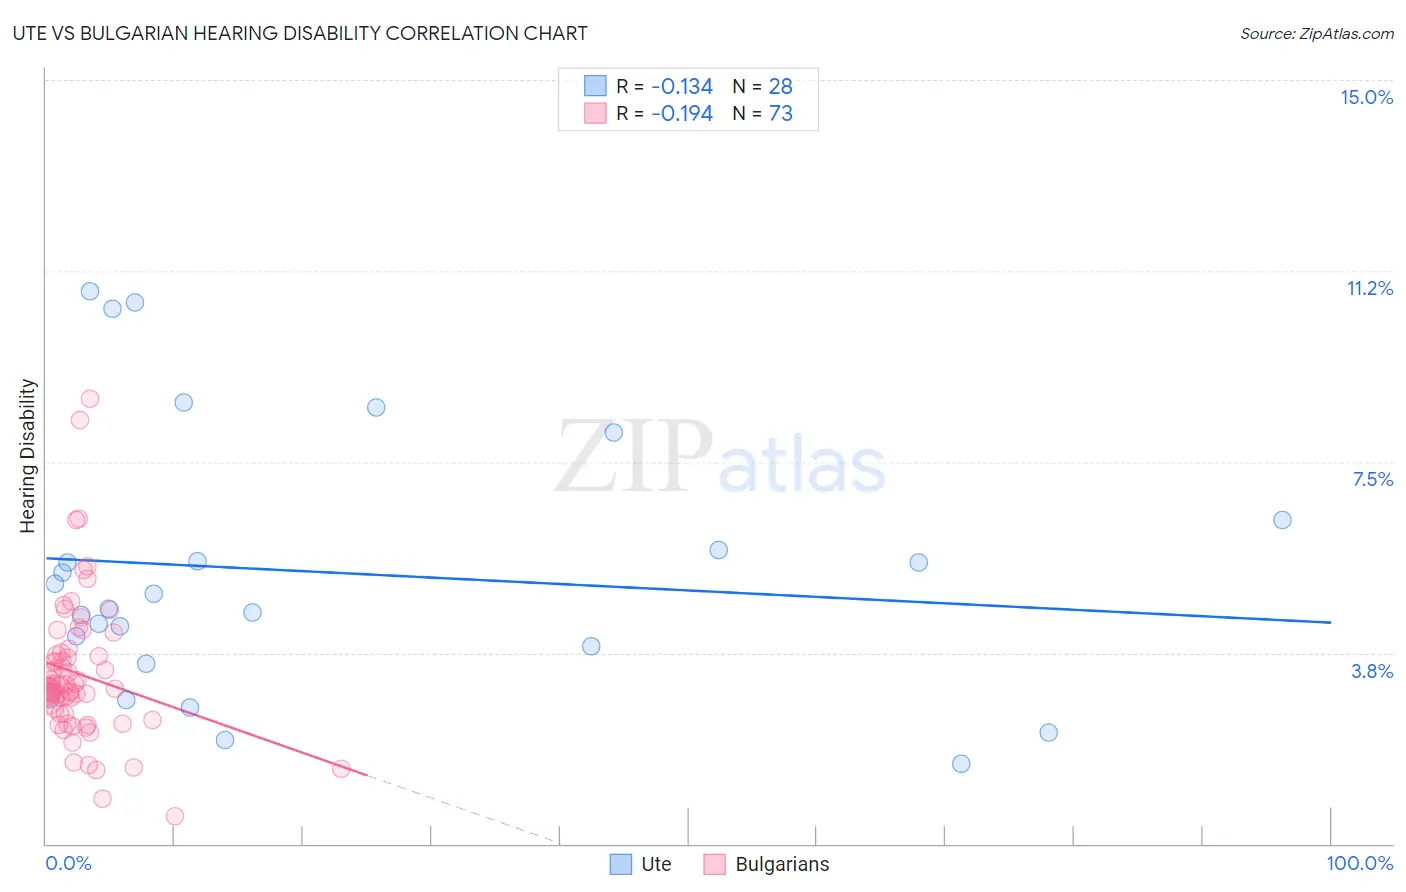
Ute vs Bulgarian Hearing Disability Correlation Chart
The statistical analysis conducted on geographies consisting of 55,656,713 people shows a poor negative correlation between the proportion of Ute and percentage of population with hearing disability in the United States with a correlation coefficient (R) of -0.134 and weighted average of 3.5%. Similarly, the statistical analysis conducted on geographies consisting of 205,610,417 people shows a poor negative correlation between the proportion of Bulgarians and percentage of population with hearing disability in the United States with a correlation coefficient (R) of -0.194 and weighted average of 3.0%, a difference of 15.7%.
Hearing Disability Correlation Summary
| Measurement | Ute | Bulgarian |
| Minimum | 1.6% | 0.54% |
| Maximum | 10.9% | 8.7% |
| Range | 9.3% | 8.2% |
| Mean | 5.3% | 3.3% |
| Median | 4.8% | 3.1% |
| Interquartile 25% (IQ1) | 3.7% | 2.5% |
| Interquartile 75% (IQ3) | 6.1% | 3.7% |
| Interquartile Range (IQR) | 2.3% | 1.2% |
| Standard Deviation (Sample) | 2.6% | 1.4% |
| Standard Deviation (Population) | 2.5% | 1.4% |
Similar Demographics by Hearing Disability
Demographics Similar to Ute by Hearing Disability
In terms of hearing disability, the demographic groups most similar to Ute are Spaniard (3.5%, a difference of 0.30%), Canadian (3.5%, a difference of 0.32%), European (3.5%, a difference of 0.35%), Belgian (3.5%, a difference of 0.54%), and Czech (3.5%, a difference of 0.61%).
| Demographics | Rating | Rank | Hearing Disability |
| Immigrants | North America | 0.1 /100 | #262 | Tragic 3.5% |
| Immigrants | Canada | 0.1 /100 | #263 | Tragic 3.5% |
| Immigrants | Germany | 0.1 /100 | #264 | Tragic 3.5% |
| British | 0.1 /100 | #265 | Tragic 3.5% |
| Belgians | 0.1 /100 | #266 | Tragic 3.5% |
| Canadians | 0.1 /100 | #267 | Tragic 3.5% |
| Spaniards | 0.1 /100 | #268 | Tragic 3.5% |
| Ute | 0.1 /100 | #269 | Tragic 3.5% |
| Europeans | 0.1 /100 | #270 | Tragic 3.5% |
| Czechs | 0.1 /100 | #271 | Tragic 3.5% |
| Fijians | 0.0 /100 | #272 | Tragic 3.5% |
| Puerto Ricans | 0.0 /100 | #273 | Tragic 3.5% |
| Swiss | 0.0 /100 | #274 | Tragic 3.5% |
| Czechoslovakians | 0.0 /100 | #275 | Tragic 3.6% |
| Danes | 0.0 /100 | #276 | Tragic 3.6% |
Demographics Similar to Bulgarians by Hearing Disability
In terms of hearing disability, the demographic groups most similar to Bulgarians are Immigrants from Italy (3.0%, a difference of 0.14%), Immigrants from Belgium (3.0%, a difference of 0.17%), Immigrants from Ireland (3.0%, a difference of 0.23%), Immigrants from Sweden (3.0%, a difference of 0.26%), and Immigrants from Moldova (3.0%, a difference of 0.32%).
| Demographics | Rating | Rank | Hearing Disability |
| Panamanians | 47.0 /100 | #176 | Average 3.0% |
| Immigrants | Philippines | 46.4 /100 | #177 | Average 3.0% |
| Japanese | 46.0 /100 | #178 | Average 3.0% |
| Immigrants | Moldova | 43.1 /100 | #179 | Average 3.0% |
| Immigrants | Sweden | 42.4 /100 | #180 | Average 3.0% |
| Immigrants | Belgium | 41.5 /100 | #181 | Average 3.0% |
| Immigrants | Italy | 41.1 /100 | #182 | Average 3.0% |
| Bulgarians | 39.7 /100 | #183 | Fair 3.0% |
| Immigrants | Ireland | 37.4 /100 | #184 | Fair 3.0% |
| Immigrants | Southern Europe | 35.3 /100 | #185 | Fair 3.0% |
| Immigrants | Mexico | 34.9 /100 | #186 | Fair 3.0% |
| Blacks/African Americans | 34.7 /100 | #187 | Fair 3.0% |
| Mexican American Indians | 34.7 /100 | #188 | Fair 3.0% |
| Africans | 32.9 /100 | #189 | Fair 3.0% |
| Immigrants | South Africa | 31.1 /100 | #190 | Fair 3.1% |