Cambodian vs Bulgarian Hearing Disability
COMPARE
Cambodian
Bulgarian
Hearing Disability
Hearing Disability Comparison
Cambodians
Bulgarians
2.8%
HEARING DISABILITY
91.1/ 100
METRIC RATING
114th/ 347
METRIC RANK
3.0%
HEARING DISABILITY
39.7/ 100
METRIC RATING
183rd/ 347
METRIC RANK
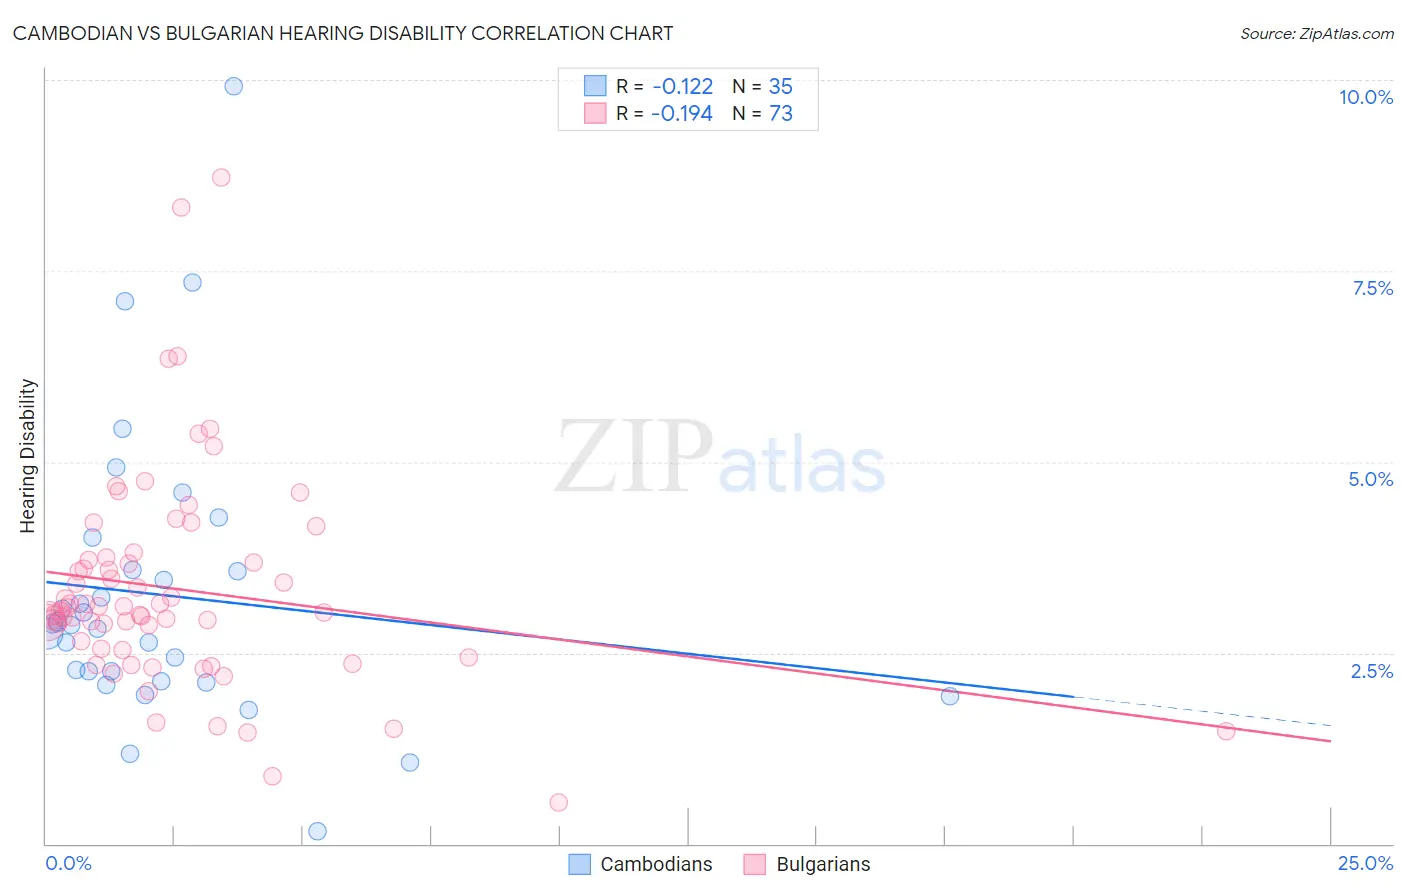
Cambodian vs Bulgarian Hearing Disability Correlation Chart
The statistical analysis conducted on geographies consisting of 102,495,279 people shows a poor negative correlation between the proportion of Cambodians and percentage of population with hearing disability in the United States with a correlation coefficient (R) of -0.122 and weighted average of 2.8%. Similarly, the statistical analysis conducted on geographies consisting of 205,610,417 people shows a poor negative correlation between the proportion of Bulgarians and percentage of population with hearing disability in the United States with a correlation coefficient (R) of -0.194 and weighted average of 3.0%, a difference of 6.8%.
Hearing Disability Correlation Summary
| Measurement | Cambodian | Bulgarian |
| Minimum | 0.17% | 0.54% |
| Maximum | 9.9% | 8.7% |
| Range | 9.7% | 8.2% |
| Mean | 3.3% | 3.3% |
| Median | 2.9% | 3.1% |
| Interquartile 25% (IQ1) | 2.1% | 2.5% |
| Interquartile 75% (IQ3) | 3.6% | 3.7% |
| Interquartile Range (IQR) | 1.4% | 1.2% |
| Standard Deviation (Sample) | 1.9% | 1.4% |
| Standard Deviation (Population) | 1.9% | 1.4% |
Similar Demographics by Hearing Disability
Demographics Similar to Cambodians by Hearing Disability
In terms of hearing disability, the demographic groups most similar to Cambodians are Immigrants from Belarus (2.8%, a difference of 0.17%), Immigrants from Latin America (2.8%, a difference of 0.17%), Immigrants (2.8%, a difference of 0.24%), Immigrants from Liberia (2.8%, a difference of 0.32%), and Zimbabwean (2.8%, a difference of 0.34%).
| Demographics | Rating | Rank | Hearing Disability |
| Immigrants | Chile | 93.4 /100 | #107 | Exceptional 2.8% |
| Guatemalans | 93.2 /100 | #108 | Exceptional 2.8% |
| Turks | 93.0 /100 | #109 | Exceptional 2.8% |
| Cypriots | 92.9 /100 | #110 | Exceptional 2.8% |
| Immigrants | Yemen | 92.7 /100 | #111 | Exceptional 2.8% |
| U.S. Virgin Islanders | 92.5 /100 | #112 | Exceptional 2.8% |
| Immigrants | Belarus | 91.6 /100 | #113 | Exceptional 2.8% |
| Cambodians | 91.1 /100 | #114 | Exceptional 2.8% |
| Immigrants | Latin America | 90.5 /100 | #115 | Exceptional 2.8% |
| Immigrants | Immigrants | 90.3 /100 | #116 | Exceptional 2.8% |
| Immigrants | Liberia | 90.0 /100 | #117 | Excellent 2.8% |
| Zimbabweans | 89.9 /100 | #118 | Excellent 2.8% |
| Kenyans | 89.8 /100 | #119 | Excellent 2.8% |
| Jordanians | 89.5 /100 | #120 | Excellent 2.8% |
| Cubans | 89.4 /100 | #121 | Excellent 2.8% |
Demographics Similar to Bulgarians by Hearing Disability
In terms of hearing disability, the demographic groups most similar to Bulgarians are Immigrants from Italy (3.0%, a difference of 0.14%), Immigrants from Belgium (3.0%, a difference of 0.17%), Immigrants from Ireland (3.0%, a difference of 0.23%), Immigrants from Sweden (3.0%, a difference of 0.26%), and Immigrants from Moldova (3.0%, a difference of 0.32%).
| Demographics | Rating | Rank | Hearing Disability |
| Panamanians | 47.0 /100 | #176 | Average 3.0% |
| Immigrants | Philippines | 46.4 /100 | #177 | Average 3.0% |
| Japanese | 46.0 /100 | #178 | Average 3.0% |
| Immigrants | Moldova | 43.1 /100 | #179 | Average 3.0% |
| Immigrants | Sweden | 42.4 /100 | #180 | Average 3.0% |
| Immigrants | Belgium | 41.5 /100 | #181 | Average 3.0% |
| Immigrants | Italy | 41.1 /100 | #182 | Average 3.0% |
| Bulgarians | 39.7 /100 | #183 | Fair 3.0% |
| Immigrants | Ireland | 37.4 /100 | #184 | Fair 3.0% |
| Immigrants | Southern Europe | 35.3 /100 | #185 | Fair 3.0% |
| Immigrants | Mexico | 34.9 /100 | #186 | Fair 3.0% |
| Blacks/African Americans | 34.7 /100 | #187 | Fair 3.0% |
| Mexican American Indians | 34.7 /100 | #188 | Fair 3.0% |
| Africans | 32.9 /100 | #189 | Fair 3.0% |
| Immigrants | South Africa | 31.1 /100 | #190 | Fair 3.1% |