Immigrants from South Eastern Asia vs Swedish Disability Age 65 to 74
COMPARE
Immigrants from South Eastern Asia
Swedish
Disability Age 65 to 74
Disability Age 65 to 74 Comparison
Immigrants from South Eastern Asia
Swedes
23.3%
DISABILITY AGE 65 TO 74
50.0/ 100
METRIC RATING
174th/ 347
METRIC RANK
22.4%
DISABILITY AGE 65 TO 74
94.7/ 100
METRIC RATING
117th/ 347
METRIC RANK
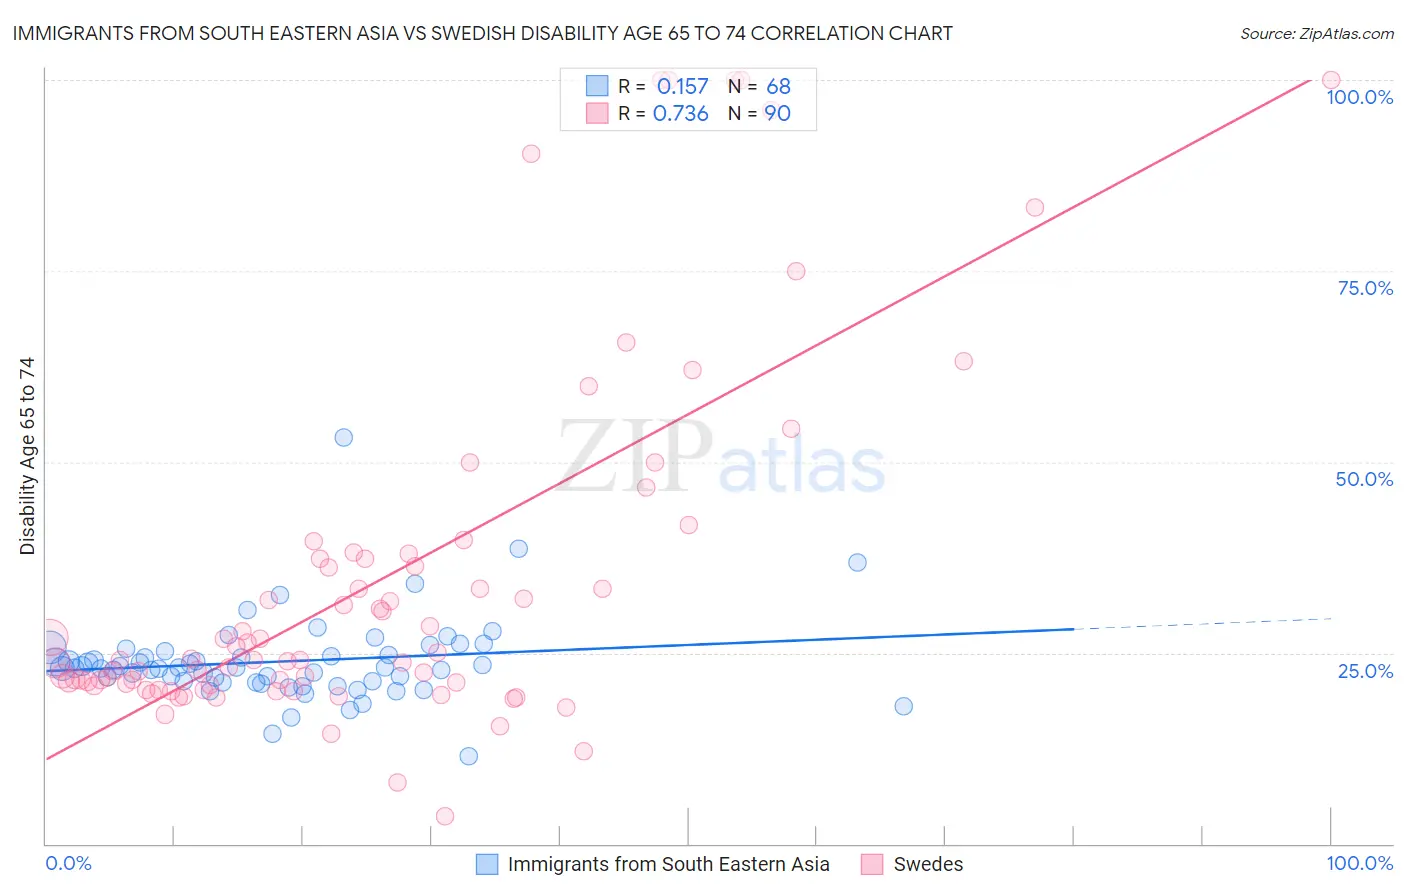
Immigrants from South Eastern Asia vs Swedish Disability Age 65 to 74 Correlation Chart
The statistical analysis conducted on geographies consisting of 511,151,711 people shows a poor positive correlation between the proportion of Immigrants from South Eastern Asia and percentage of population with a disability between the ages 65 and 75 in the United States with a correlation coefficient (R) of 0.157 and weighted average of 23.3%. Similarly, the statistical analysis conducted on geographies consisting of 537,372,214 people shows a strong positive correlation between the proportion of Swedes and percentage of population with a disability between the ages 65 and 75 in the United States with a correlation coefficient (R) of 0.736 and weighted average of 22.4%, a difference of 4.4%.
Disability Age 65 to 74 Correlation Summary
| Measurement | Immigrants from South Eastern Asia | Swedish |
| Minimum | 11.5% | 3.7% |
| Maximum | 53.2% | 100.0% |
| Range | 41.6% | 96.3% |
| Mean | 23.9% | 34.3% |
| Median | 23.0% | 24.0% |
| Interquartile 25% (IQ1) | 21.2% | 20.8% |
| Interquartile 75% (IQ3) | 25.0% | 37.4% |
| Interquartile Range (IQR) | 3.7% | 16.6% |
| Standard Deviation (Sample) | 5.7% | 23.2% |
| Standard Deviation (Population) | 5.6% | 23.0% |
Similar Demographics by Disability Age 65 to 74
Demographics Similar to Immigrants from South Eastern Asia by Disability Age 65 to 74
In terms of disability age 65 to 74, the demographic groups most similar to Immigrants from South Eastern Asia are Yugoslavian (23.3%, a difference of 0.010%), German (23.3%, a difference of 0.030%), Dutch (23.3%, a difference of 0.040%), Cuban (23.3%, a difference of 0.11%), and Immigrants from Eritrea (23.4%, a difference of 0.14%).
| Demographics | Rating | Rank | Disability Age 65 to 74 |
| Immigrants | Bosnia and Herzegovina | 57.6 /100 | #167 | Average 23.2% |
| Pakistanis | 57.0 /100 | #168 | Average 23.2% |
| Icelanders | 54.3 /100 | #169 | Average 23.3% |
| Moroccans | 54.2 /100 | #170 | Average 23.3% |
| Cubans | 51.9 /100 | #171 | Average 23.3% |
| Germans | 50.5 /100 | #172 | Average 23.3% |
| Yugoslavians | 50.2 /100 | #173 | Average 23.3% |
| Immigrants | South Eastern Asia | 50.0 /100 | #174 | Average 23.3% |
| Dutch | 49.4 /100 | #175 | Average 23.3% |
| Immigrants | Eritrea | 47.5 /100 | #176 | Average 23.4% |
| Immigrants | Haiti | 47.5 /100 | #177 | Average 23.4% |
| Guyanese | 45.8 /100 | #178 | Average 23.4% |
| Immigrants | Sierra Leone | 45.8 /100 | #179 | Average 23.4% |
| Scandinavians | 45.6 /100 | #180 | Average 23.4% |
| Assyrians/Chaldeans/Syriacs | 45.3 /100 | #181 | Average 23.4% |
Demographics Similar to Swedes by Disability Age 65 to 74
In terms of disability age 65 to 74, the demographic groups most similar to Swedes are Austrian (22.4%, a difference of 0.0%), Brazilian (22.4%, a difference of 0.010%), Immigrants from Northern Africa (22.4%, a difference of 0.010%), Laotian (22.3%, a difference of 0.050%), and Ukrainian (22.3%, a difference of 0.12%).
| Demographics | Rating | Rank | Disability Age 65 to 74 |
| Immigrants | Peru | 95.7 /100 | #110 | Exceptional 22.3% |
| Serbians | 95.7 /100 | #111 | Exceptional 22.3% |
| Immigrants | South America | 95.5 /100 | #112 | Exceptional 22.3% |
| Syrians | 95.3 /100 | #113 | Exceptional 22.3% |
| Ukrainians | 95.1 /100 | #114 | Exceptional 22.3% |
| Laotians | 94.9 /100 | #115 | Exceptional 22.3% |
| Brazilians | 94.8 /100 | #116 | Exceptional 22.4% |
| Swedes | 94.7 /100 | #117 | Exceptional 22.4% |
| Austrians | 94.7 /100 | #118 | Exceptional 22.4% |
| Immigrants | Northern Africa | 94.7 /100 | #119 | Exceptional 22.4% |
| Immigrants | Kazakhstan | 93.9 /100 | #120 | Exceptional 22.4% |
| Czechs | 93.5 /100 | #121 | Exceptional 22.4% |
| Immigrants | Jordan | 93.5 /100 | #122 | Exceptional 22.4% |
| Hungarians | 93.3 /100 | #123 | Exceptional 22.4% |
| Norwegians | 92.5 /100 | #124 | Exceptional 22.5% |