Immigrants from Jamaica vs Swedish Disability Age 65 to 74
COMPARE
Immigrants from Jamaica
Swedish
Disability Age 65 to 74
Disability Age 65 to 74 Comparison
Immigrants from Jamaica
Swedes
23.8%
DISABILITY AGE 65 TO 74
20.7/ 100
METRIC RATING
206th/ 347
METRIC RANK
22.4%
DISABILITY AGE 65 TO 74
94.7/ 100
METRIC RATING
117th/ 347
METRIC RANK
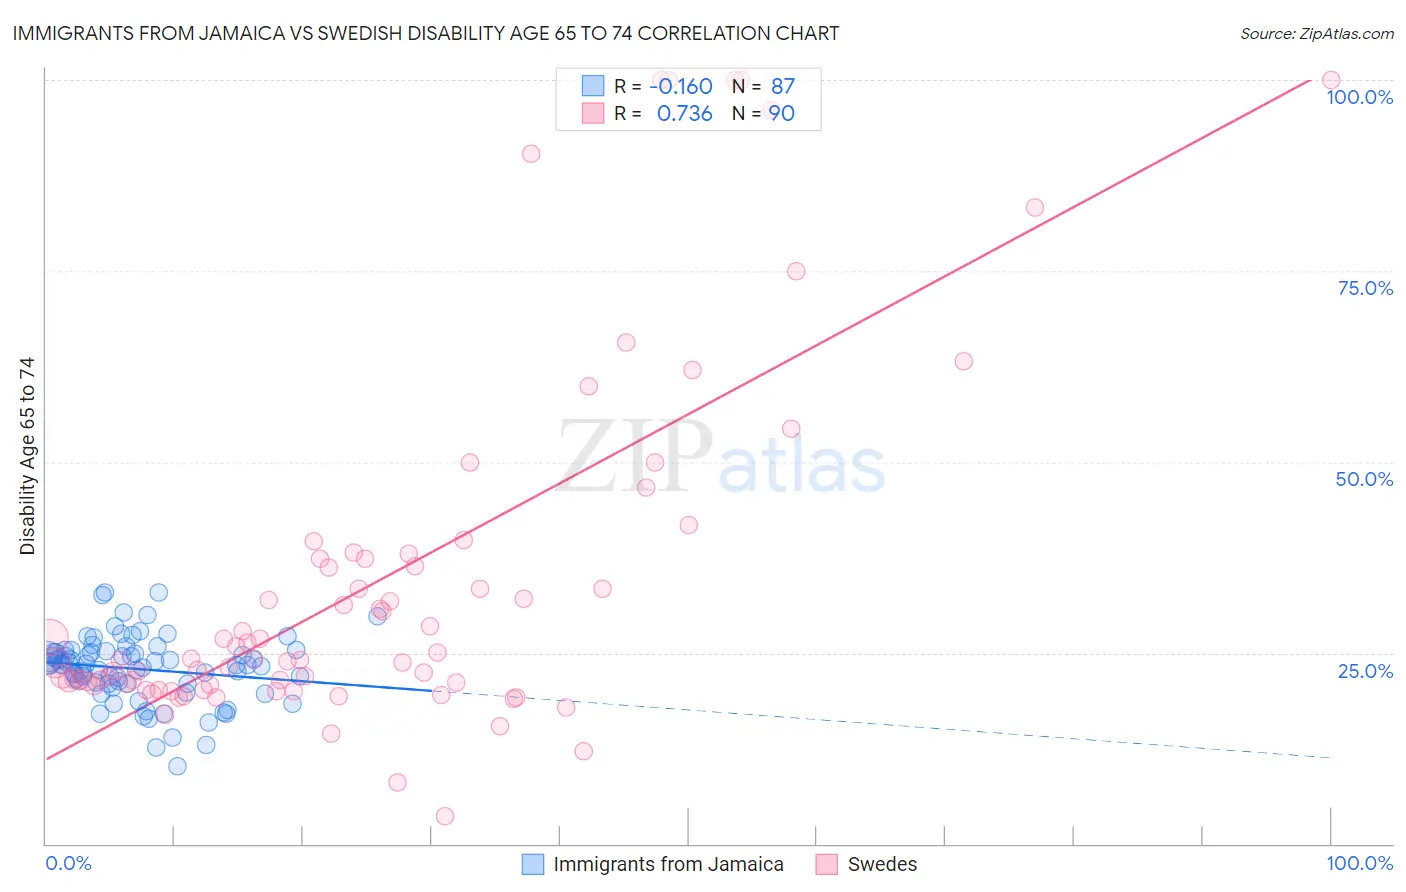
Immigrants from Jamaica vs Swedish Disability Age 65 to 74 Correlation Chart
The statistical analysis conducted on geographies consisting of 301,108,871 people shows a poor negative correlation between the proportion of Immigrants from Jamaica and percentage of population with a disability between the ages 65 and 75 in the United States with a correlation coefficient (R) of -0.160 and weighted average of 23.8%. Similarly, the statistical analysis conducted on geographies consisting of 537,372,214 people shows a strong positive correlation between the proportion of Swedes and percentage of population with a disability between the ages 65 and 75 in the United States with a correlation coefficient (R) of 0.736 and weighted average of 22.4%, a difference of 6.4%.
Disability Age 65 to 74 Correlation Summary
| Measurement | Immigrants from Jamaica | Swedish |
| Minimum | 10.1% | 3.7% |
| Maximum | 32.9% | 100.0% |
| Range | 22.8% | 96.3% |
| Mean | 22.9% | 34.3% |
| Median | 23.5% | 24.0% |
| Interquartile 25% (IQ1) | 20.9% | 20.8% |
| Interquartile 75% (IQ3) | 25.1% | 37.4% |
| Interquartile Range (IQR) | 4.1% | 16.6% |
| Standard Deviation (Sample) | 4.3% | 23.2% |
| Standard Deviation (Population) | 4.3% | 23.0% |
Similar Demographics by Disability Age 65 to 74
Demographics Similar to Immigrants from Jamaica by Disability Age 65 to 74
In terms of disability age 65 to 74, the demographic groups most similar to Immigrants from Jamaica are Tongan (23.8%, a difference of 0.0%), Immigrants from Sudan (23.8%, a difference of 0.060%), Immigrants from Barbados (23.8%, a difference of 0.10%), Immigrants from Grenada (23.8%, a difference of 0.11%), and Immigrants from Kenya (23.8%, a difference of 0.11%).
| Demographics | Rating | Rank | Disability Age 65 to 74 |
| Welsh | 24.3 /100 | #199 | Fair 23.7% |
| French Canadians | 24.0 /100 | #200 | Fair 23.7% |
| Immigrants | Ecuador | 23.9 /100 | #201 | Fair 23.7% |
| Immigrants | Bahamas | 23.3 /100 | #202 | Fair 23.7% |
| Kenyans | 23.2 /100 | #203 | Fair 23.7% |
| Immigrants | Grenada | 22.1 /100 | #204 | Fair 23.8% |
| Tongans | 20.8 /100 | #205 | Fair 23.8% |
| Immigrants | Jamaica | 20.7 /100 | #206 | Fair 23.8% |
| Immigrants | Sudan | 20.1 /100 | #207 | Fair 23.8% |
| Immigrants | Barbados | 19.6 /100 | #208 | Poor 23.8% |
| Immigrants | Kenya | 19.6 /100 | #209 | Poor 23.8% |
| Trinidadians and Tobagonians | 16.4 /100 | #210 | Poor 23.9% |
| Immigrants | West Indies | 15.9 /100 | #211 | Poor 23.9% |
| French | 15.7 /100 | #212 | Poor 23.9% |
| Nicaraguans | 14.3 /100 | #213 | Poor 23.9% |
Demographics Similar to Swedes by Disability Age 65 to 74
In terms of disability age 65 to 74, the demographic groups most similar to Swedes are Austrian (22.4%, a difference of 0.0%), Brazilian (22.4%, a difference of 0.010%), Immigrants from Northern Africa (22.4%, a difference of 0.010%), Laotian (22.3%, a difference of 0.050%), and Ukrainian (22.3%, a difference of 0.12%).
| Demographics | Rating | Rank | Disability Age 65 to 74 |
| Immigrants | Peru | 95.7 /100 | #110 | Exceptional 22.3% |
| Serbians | 95.7 /100 | #111 | Exceptional 22.3% |
| Immigrants | South America | 95.5 /100 | #112 | Exceptional 22.3% |
| Syrians | 95.3 /100 | #113 | Exceptional 22.3% |
| Ukrainians | 95.1 /100 | #114 | Exceptional 22.3% |
| Laotians | 94.9 /100 | #115 | Exceptional 22.3% |
| Brazilians | 94.8 /100 | #116 | Exceptional 22.4% |
| Swedes | 94.7 /100 | #117 | Exceptional 22.4% |
| Austrians | 94.7 /100 | #118 | Exceptional 22.4% |
| Immigrants | Northern Africa | 94.7 /100 | #119 | Exceptional 22.4% |
| Immigrants | Kazakhstan | 93.9 /100 | #120 | Exceptional 22.4% |
| Czechs | 93.5 /100 | #121 | Exceptional 22.4% |
| Immigrants | Jordan | 93.5 /100 | #122 | Exceptional 22.4% |
| Hungarians | 93.3 /100 | #123 | Exceptional 22.4% |
| Norwegians | 92.5 /100 | #124 | Exceptional 22.5% |