Native/Alaskan vs Immigrants from Cabo Verde Vision Disability
COMPARE
Native/Alaskan
Immigrants from Cabo Verde
Vision Disability
Vision Disability Comparison
Natives/Alaskans
Immigrants from Cabo Verde
3.0%
VISION DISABILITY
0.0/ 100
METRIC RATING
327th/ 347
METRIC RANK
2.6%
VISION DISABILITY
0.0/ 100
METRIC RATING
303rd/ 347
METRIC RANK
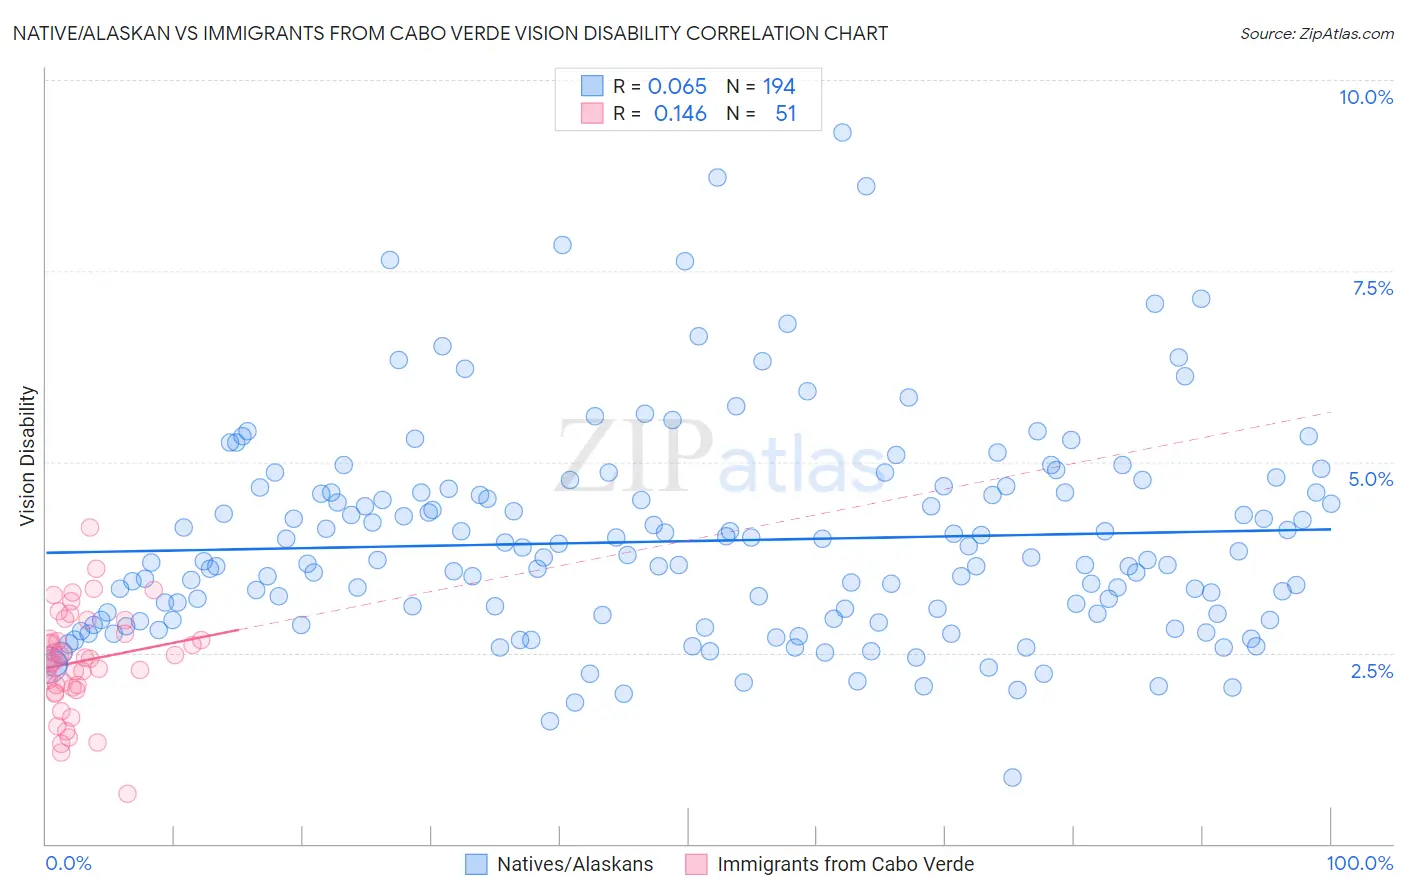
Native/Alaskan vs Immigrants from Cabo Verde Vision Disability Correlation Chart
The statistical analysis conducted on geographies consisting of 512,205,418 people shows a slight positive correlation between the proportion of Natives/Alaskans and percentage of population with vision disability in the United States with a correlation coefficient (R) of 0.065 and weighted average of 3.0%. Similarly, the statistical analysis conducted on geographies consisting of 38,135,099 people shows a poor positive correlation between the proportion of Immigrants from Cabo Verde and percentage of population with vision disability in the United States with a correlation coefficient (R) of 0.146 and weighted average of 2.6%, a difference of 15.0%.
Vision Disability Correlation Summary
| Measurement | Native/Alaskan | Immigrants from Cabo Verde |
| Minimum | 0.86% | 0.65% |
| Maximum | 9.3% | 4.1% |
| Range | 8.5% | 3.5% |
| Mean | 4.0% | 2.4% |
| Median | 3.7% | 2.4% |
| Interquartile 25% (IQ1) | 2.9% | 2.1% |
| Interquartile 75% (IQ3) | 4.6% | 2.8% |
| Interquartile Range (IQR) | 1.7% | 0.70% |
| Standard Deviation (Sample) | 1.4% | 0.67% |
| Standard Deviation (Population) | 1.4% | 0.66% |
Similar Demographics by Vision Disability
Demographics Similar to Natives/Alaskans by Vision Disability
In terms of vision disability, the demographic groups most similar to Natives/Alaskans are Yuman (3.0%, a difference of 0.54%), Apache (3.0%, a difference of 0.74%), Spanish American (2.9%, a difference of 0.80%), Colville (3.0%, a difference of 1.9%), and Cherokee (2.9%, a difference of 2.0%).
| Demographics | Rating | Rank | Vision Disability |
| Blacks/African Americans | 0.0 /100 | #320 | Tragic 2.8% |
| Comanche | 0.0 /100 | #321 | Tragic 2.8% |
| Paiute | 0.0 /100 | #322 | Tragic 2.9% |
| Tlingit-Haida | 0.0 /100 | #323 | Tragic 2.9% |
| Hopi | 0.0 /100 | #324 | Tragic 2.9% |
| Cherokee | 0.0 /100 | #325 | Tragic 2.9% |
| Spanish Americans | 0.0 /100 | #326 | Tragic 2.9% |
| Natives/Alaskans | 0.0 /100 | #327 | Tragic 3.0% |
| Yuman | 0.0 /100 | #328 | Tragic 3.0% |
| Apache | 0.0 /100 | #329 | Tragic 3.0% |
| Colville | 0.0 /100 | #330 | Tragic 3.0% |
| Central American Indians | 0.0 /100 | #331 | Tragic 3.0% |
| Seminole | 0.0 /100 | #332 | Tragic 3.1% |
| Cajuns | 0.0 /100 | #333 | Tragic 3.1% |
| Cheyenne | 0.0 /100 | #334 | Tragic 3.1% |
Demographics Similar to Immigrants from Cabo Verde by Vision Disability
In terms of vision disability, the demographic groups most similar to Immigrants from Cabo Verde are Aleut (2.6%, a difference of 0.13%), Spanish American Indian (2.6%, a difference of 0.22%), Hispanic or Latino (2.6%, a difference of 0.43%), Iroquois (2.6%, a difference of 1.1%), and Immigrants from Dominican Republic (2.6%, a difference of 1.1%).
| Demographics | Rating | Rank | Vision Disability |
| Immigrants | Mexico | 0.0 /100 | #296 | Tragic 2.5% |
| Immigrants | Dominica | 0.0 /100 | #297 | Tragic 2.5% |
| Mexicans | 0.0 /100 | #298 | Tragic 2.5% |
| Cree | 0.0 /100 | #299 | Tragic 2.5% |
| Africans | 0.0 /100 | #300 | Tragic 2.5% |
| Menominee | 0.0 /100 | #301 | Tragic 2.5% |
| Spanish American Indians | 0.0 /100 | #302 | Tragic 2.6% |
| Immigrants | Cabo Verde | 0.0 /100 | #303 | Tragic 2.6% |
| Aleuts | 0.0 /100 | #304 | Tragic 2.6% |
| Hispanics or Latinos | 0.0 /100 | #305 | Tragic 2.6% |
| Iroquois | 0.0 /100 | #306 | Tragic 2.6% |
| Immigrants | Dominican Republic | 0.0 /100 | #307 | Tragic 2.6% |
| Arapaho | 0.0 /100 | #308 | Tragic 2.6% |
| Immigrants | Yemen | 0.0 /100 | #309 | Tragic 2.6% |
| Blackfeet | 0.0 /100 | #310 | Tragic 2.6% |