Native/Alaskan vs Immigrants from Eastern Europe Vision Disability
COMPARE
Native/Alaskan
Immigrants from Eastern Europe
Vision Disability
Vision Disability Comparison
Natives/Alaskans
Immigrants from Eastern Europe
3.0%
VISION DISABILITY
0.0/ 100
METRIC RATING
327th/ 347
METRIC RANK
2.0%
VISION DISABILITY
98.3/ 100
METRIC RATING
78th/ 347
METRIC RANK
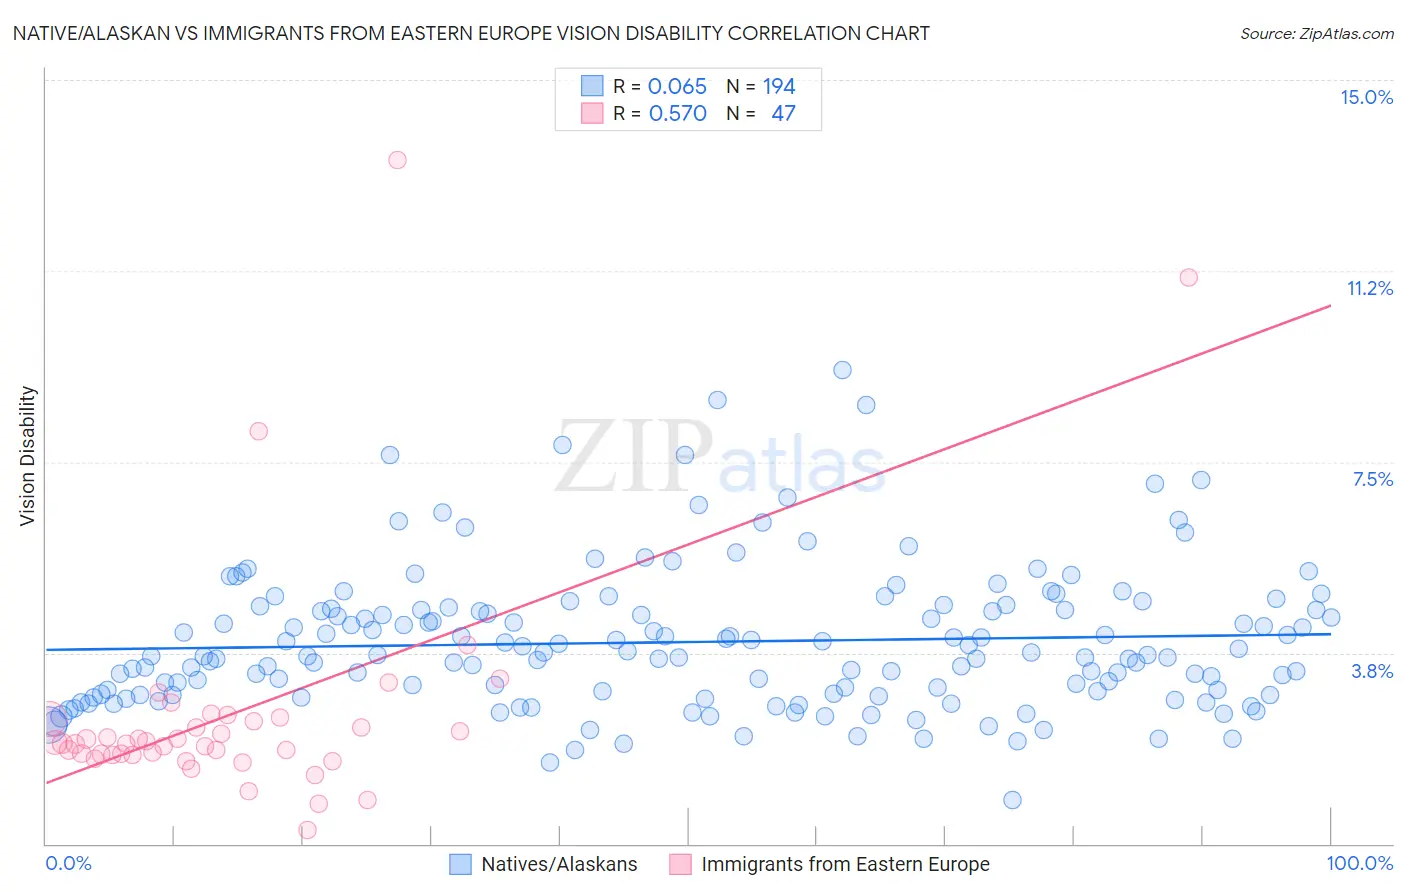
Native/Alaskan vs Immigrants from Eastern Europe Vision Disability Correlation Chart
The statistical analysis conducted on geographies consisting of 512,205,418 people shows a slight positive correlation between the proportion of Natives/Alaskans and percentage of population with vision disability in the United States with a correlation coefficient (R) of 0.065 and weighted average of 3.0%. Similarly, the statistical analysis conducted on geographies consisting of 475,183,449 people shows a substantial positive correlation between the proportion of Immigrants from Eastern Europe and percentage of population with vision disability in the United States with a correlation coefficient (R) of 0.570 and weighted average of 2.0%, a difference of 46.3%.
Vision Disability Correlation Summary
| Measurement | Native/Alaskan | Immigrants from Eastern Europe |
| Minimum | 0.86% | 0.27% |
| Maximum | 9.3% | 13.4% |
| Range | 8.5% | 13.2% |
| Mean | 4.0% | 2.6% |
| Median | 3.7% | 2.0% |
| Interquartile 25% (IQ1) | 2.9% | 1.8% |
| Interquartile 75% (IQ3) | 4.6% | 2.4% |
| Interquartile Range (IQR) | 1.7% | 0.70% |
| Standard Deviation (Sample) | 1.4% | 2.3% |
| Standard Deviation (Population) | 1.4% | 2.3% |
Similar Demographics by Vision Disability
Demographics Similar to Natives/Alaskans by Vision Disability
In terms of vision disability, the demographic groups most similar to Natives/Alaskans are Yuman (3.0%, a difference of 0.54%), Apache (3.0%, a difference of 0.74%), Spanish American (2.9%, a difference of 0.80%), Colville (3.0%, a difference of 1.9%), and Cherokee (2.9%, a difference of 2.0%).
| Demographics | Rating | Rank | Vision Disability |
| Blacks/African Americans | 0.0 /100 | #320 | Tragic 2.8% |
| Comanche | 0.0 /100 | #321 | Tragic 2.8% |
| Paiute | 0.0 /100 | #322 | Tragic 2.9% |
| Tlingit-Haida | 0.0 /100 | #323 | Tragic 2.9% |
| Hopi | 0.0 /100 | #324 | Tragic 2.9% |
| Cherokee | 0.0 /100 | #325 | Tragic 2.9% |
| Spanish Americans | 0.0 /100 | #326 | Tragic 2.9% |
| Natives/Alaskans | 0.0 /100 | #327 | Tragic 3.0% |
| Yuman | 0.0 /100 | #328 | Tragic 3.0% |
| Apache | 0.0 /100 | #329 | Tragic 3.0% |
| Colville | 0.0 /100 | #330 | Tragic 3.0% |
| Central American Indians | 0.0 /100 | #331 | Tragic 3.0% |
| Seminole | 0.0 /100 | #332 | Tragic 3.1% |
| Cajuns | 0.0 /100 | #333 | Tragic 3.1% |
| Cheyenne | 0.0 /100 | #334 | Tragic 3.1% |
Demographics Similar to Immigrants from Eastern Europe by Vision Disability
In terms of vision disability, the demographic groups most similar to Immigrants from Eastern Europe are Paraguayan (2.0%, a difference of 0.030%), Immigrants from Jordan (2.0%, a difference of 0.030%), Palestinian (2.0%, a difference of 0.050%), Immigrants from North Macedonia (2.0%, a difference of 0.050%), and Immigrants from Eritrea (2.0%, a difference of 0.11%).
| Demographics | Rating | Rank | Vision Disability |
| Immigrants | Northern Europe | 98.6 /100 | #71 | Exceptional 2.0% |
| Immigrants | France | 98.5 /100 | #72 | Exceptional 2.0% |
| Immigrants | Eritrea | 98.4 /100 | #73 | Exceptional 2.0% |
| Palestinians | 98.3 /100 | #74 | Exceptional 2.0% |
| Immigrants | North Macedonia | 98.3 /100 | #75 | Exceptional 2.0% |
| Paraguayans | 98.3 /100 | #76 | Exceptional 2.0% |
| Immigrants | Jordan | 98.3 /100 | #77 | Exceptional 2.0% |
| Immigrants | Eastern Europe | 98.3 /100 | #78 | Exceptional 2.0% |
| Assyrians/Chaldeans/Syriacs | 98.1 /100 | #79 | Exceptional 2.0% |
| Lithuanians | 97.7 /100 | #80 | Exceptional 2.0% |
| Soviet Union | 97.6 /100 | #81 | Exceptional 2.0% |
| Immigrants | Poland | 97.6 /100 | #82 | Exceptional 2.0% |
| Immigrants | Western Asia | 97.5 /100 | #83 | Exceptional 2.0% |
| Immigrants | Latvia | 97.3 /100 | #84 | Exceptional 2.0% |
| Chinese | 97.2 /100 | #85 | Exceptional 2.0% |