Immigrants from Latin America vs Senegalese Vision Disability
COMPARE
Immigrants from Latin America
Senegalese
Vision Disability
Vision Disability Comparison
Immigrants from Latin America
Senegalese
2.4%
VISION DISABILITY
0.0/ 100
METRIC RATING
274th/ 347
METRIC RANK
2.4%
VISION DISABILITY
0.1/ 100
METRIC RATING
268th/ 347
METRIC RANK
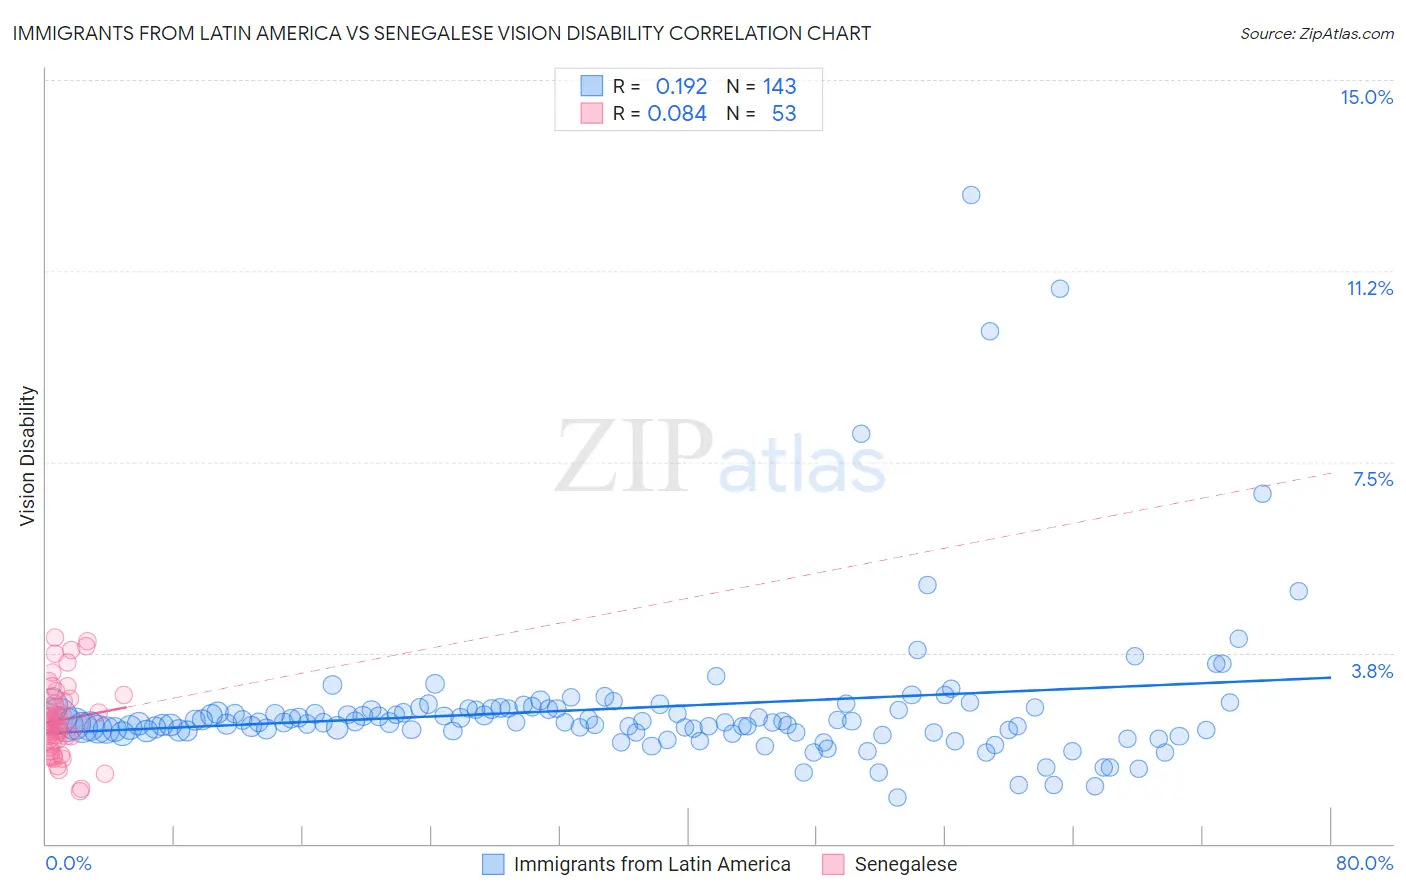
Immigrants from Latin America vs Senegalese Vision Disability Correlation Chart
The statistical analysis conducted on geographies consisting of 557,074,297 people shows a poor positive correlation between the proportion of Immigrants from Latin America and percentage of population with vision disability in the United States with a correlation coefficient (R) of 0.192 and weighted average of 2.4%. Similarly, the statistical analysis conducted on geographies consisting of 78,129,878 people shows a slight positive correlation between the proportion of Senegalese and percentage of population with vision disability in the United States with a correlation coefficient (R) of 0.084 and weighted average of 2.4%, a difference of 1.2%.
Vision Disability Correlation Summary
| Measurement | Immigrants from Latin America | Senegalese |
| Minimum | 0.90% | 1.0% |
| Maximum | 12.7% | 4.0% |
| Range | 11.8% | 3.0% |
| Mean | 2.7% | 2.4% |
| Median | 2.4% | 2.4% |
| Interquartile 25% (IQ1) | 2.2% | 1.9% |
| Interquartile 75% (IQ3) | 2.7% | 2.9% |
| Interquartile Range (IQR) | 0.43% | 0.95% |
| Standard Deviation (Sample) | 1.5% | 0.72% |
| Standard Deviation (Population) | 1.5% | 0.72% |
Demographics Similar to Immigrants from Latin America and Senegalese by Vision Disability
In terms of vision disability, the demographic groups most similar to Immigrants from Latin America are Immigrants from Bahamas (2.4%, a difference of 0.31%), Chippewa (2.4%, a difference of 0.32%), Scotch-Irish (2.4%, a difference of 0.41%), Bahamian (2.4%, a difference of 0.45%), and Spanish (2.4%, a difference of 0.61%). Similarly, the demographic groups most similar to Senegalese are Ute (2.4%, a difference of 0.090%), Mexican American Indian (2.4%, a difference of 0.10%), Immigrants from Jamaica (2.4%, a difference of 0.14%), Immigrants from Liberia (2.4%, a difference of 0.16%), and Celtic (2.4%, a difference of 0.27%).
| Demographics | Rating | Rank | Vision Disability |
| Fijians | 0.1 /100 | #261 | Tragic 2.4% |
| Jamaicans | 0.1 /100 | #262 | Tragic 2.4% |
| Immigrants | Belize | 0.1 /100 | #263 | Tragic 2.4% |
| Immigrants | Liberia | 0.1 /100 | #264 | Tragic 2.4% |
| Immigrants | Jamaica | 0.1 /100 | #265 | Tragic 2.4% |
| Mexican American Indians | 0.1 /100 | #266 | Tragic 2.4% |
| Ute | 0.1 /100 | #267 | Tragic 2.4% |
| Senegalese | 0.1 /100 | #268 | Tragic 2.4% |
| Celtics | 0.1 /100 | #269 | Tragic 2.4% |
| Cubans | 0.1 /100 | #270 | Tragic 2.4% |
| Immigrants | Azores | 0.1 /100 | #271 | Tragic 2.4% |
| Spaniards | 0.1 /100 | #272 | Tragic 2.4% |
| Immigrants | Bahamas | 0.1 /100 | #273 | Tragic 2.4% |
| Immigrants | Latin America | 0.0 /100 | #274 | Tragic 2.4% |
| Chippewa | 0.0 /100 | #275 | Tragic 2.4% |
| Scotch-Irish | 0.0 /100 | #276 | Tragic 2.4% |
| Bahamians | 0.0 /100 | #277 | Tragic 2.4% |
| Spanish | 0.0 /100 | #278 | Tragic 2.4% |
| Nepalese | 0.0 /100 | #279 | Tragic 2.4% |
| Cape Verdeans | 0.0 /100 | #280 | Tragic 2.4% |
| U.S. Virgin Islanders | 0.0 /100 | #281 | Tragic 2.5% |