South American Indian vs Senegalese Vision Disability
COMPARE
South American Indian
Senegalese
Vision Disability
Vision Disability Comparison
South American Indians
Senegalese
2.2%
VISION DISABILITY
57.4/ 100
METRIC RATING
169th/ 347
METRIC RANK
2.4%
VISION DISABILITY
0.1/ 100
METRIC RATING
268th/ 347
METRIC RANK
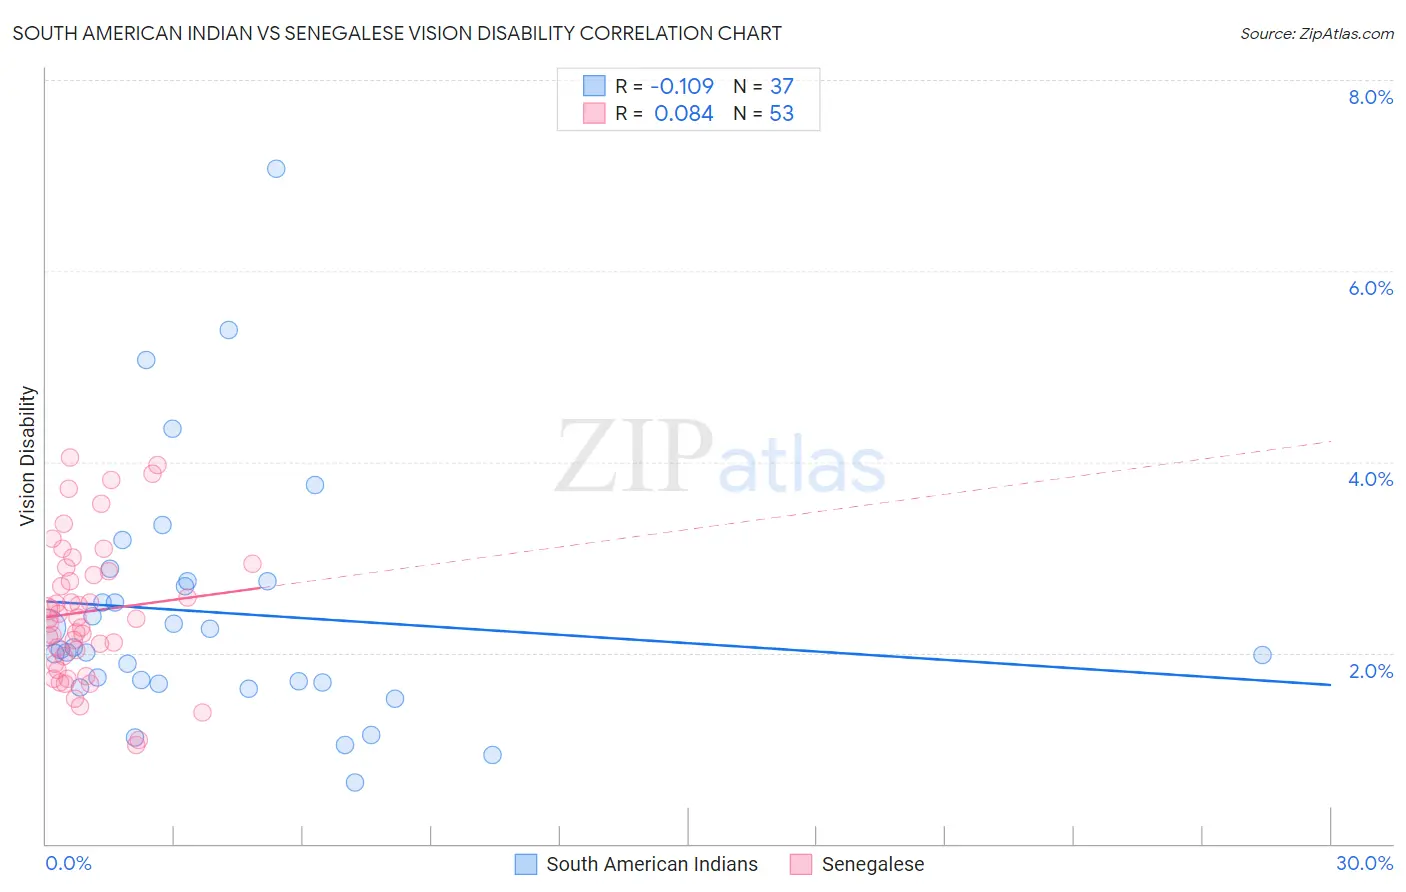
South American Indian vs Senegalese Vision Disability Correlation Chart
The statistical analysis conducted on geographies consisting of 164,540,973 people shows a poor negative correlation between the proportion of South American Indians and percentage of population with vision disability in the United States with a correlation coefficient (R) of -0.109 and weighted average of 2.2%. Similarly, the statistical analysis conducted on geographies consisting of 78,129,878 people shows a slight positive correlation between the proportion of Senegalese and percentage of population with vision disability in the United States with a correlation coefficient (R) of 0.084 and weighted average of 2.4%, a difference of 11.4%.
Vision Disability Correlation Summary
| Measurement | South American Indian | Senegalese |
| Minimum | 0.64% | 1.0% |
| Maximum | 7.1% | 4.0% |
| Range | 6.4% | 3.0% |
| Mean | 2.4% | 2.4% |
| Median | 2.0% | 2.4% |
| Interquartile 25% (IQ1) | 1.7% | 1.9% |
| Interquartile 75% (IQ3) | 2.8% | 2.9% |
| Interquartile Range (IQR) | 1.1% | 0.95% |
| Standard Deviation (Sample) | 1.3% | 0.72% |
| Standard Deviation (Population) | 1.3% | 0.72% |
Similar Demographics by Vision Disability
Demographics Similar to South American Indians by Vision Disability
In terms of vision disability, the demographic groups most similar to South American Indians are Swiss (2.2%, a difference of 0.11%), Lebanese (2.2%, a difference of 0.20%), Brazilian (2.1%, a difference of 0.32%), Immigrants from Africa (2.1%, a difference of 0.34%), and Immigrants from England (2.1%, a difference of 0.36%).
| Demographics | Rating | Rank | Vision Disability |
| Hungarians | 67.4 /100 | #162 | Good 2.1% |
| Icelanders | 66.1 /100 | #163 | Good 2.1% |
| Immigrants | Bangladesh | 65.5 /100 | #164 | Good 2.1% |
| Immigrants | Iraq | 64.8 /100 | #165 | Good 2.1% |
| Immigrants | England | 62.8 /100 | #166 | Good 2.1% |
| Immigrants | Africa | 62.6 /100 | #167 | Good 2.1% |
| Brazilians | 62.2 /100 | #168 | Good 2.1% |
| South American Indians | 57.4 /100 | #169 | Average 2.2% |
| Swiss | 55.7 /100 | #170 | Average 2.2% |
| Lebanese | 54.3 /100 | #171 | Average 2.2% |
| Northern Europeans | 50.1 /100 | #172 | Average 2.2% |
| Scandinavians | 50.0 /100 | #173 | Average 2.2% |
| Immigrants | Canada | 50.0 /100 | #174 | Average 2.2% |
| Immigrants | Fiji | 47.6 /100 | #175 | Average 2.2% |
| Yugoslavians | 46.5 /100 | #176 | Average 2.2% |
Demographics Similar to Senegalese by Vision Disability
In terms of vision disability, the demographic groups most similar to Senegalese are Ute (2.4%, a difference of 0.090%), Mexican American Indian (2.4%, a difference of 0.10%), Immigrants from Jamaica (2.4%, a difference of 0.14%), Immigrants from Liberia (2.4%, a difference of 0.16%), and Celtic (2.4%, a difference of 0.27%).
| Demographics | Rating | Rank | Vision Disability |
| Fijians | 0.1 /100 | #261 | Tragic 2.4% |
| Jamaicans | 0.1 /100 | #262 | Tragic 2.4% |
| Immigrants | Belize | 0.1 /100 | #263 | Tragic 2.4% |
| Immigrants | Liberia | 0.1 /100 | #264 | Tragic 2.4% |
| Immigrants | Jamaica | 0.1 /100 | #265 | Tragic 2.4% |
| Mexican American Indians | 0.1 /100 | #266 | Tragic 2.4% |
| Ute | 0.1 /100 | #267 | Tragic 2.4% |
| Senegalese | 0.1 /100 | #268 | Tragic 2.4% |
| Celtics | 0.1 /100 | #269 | Tragic 2.4% |
| Cubans | 0.1 /100 | #270 | Tragic 2.4% |
| Immigrants | Azores | 0.1 /100 | #271 | Tragic 2.4% |
| Spaniards | 0.1 /100 | #272 | Tragic 2.4% |
| Immigrants | Bahamas | 0.1 /100 | #273 | Tragic 2.4% |
| Immigrants | Latin America | 0.0 /100 | #274 | Tragic 2.4% |
| Chippewa | 0.0 /100 | #275 | Tragic 2.4% |