Native/Alaskan vs Immigrants from Nepal Female Disability
COMPARE
Native/Alaskan
Immigrants from Nepal
Female Disability
Female Disability Comparison
Natives/Alaskans
Immigrants from Nepal
14.1%
FEMALE DISABILITY
0.0/ 100
METRIC RATING
324th/ 347
METRIC RANK
11.3%
FEMALE DISABILITY
100.0/ 100
METRIC RATING
46th/ 347
METRIC RANK
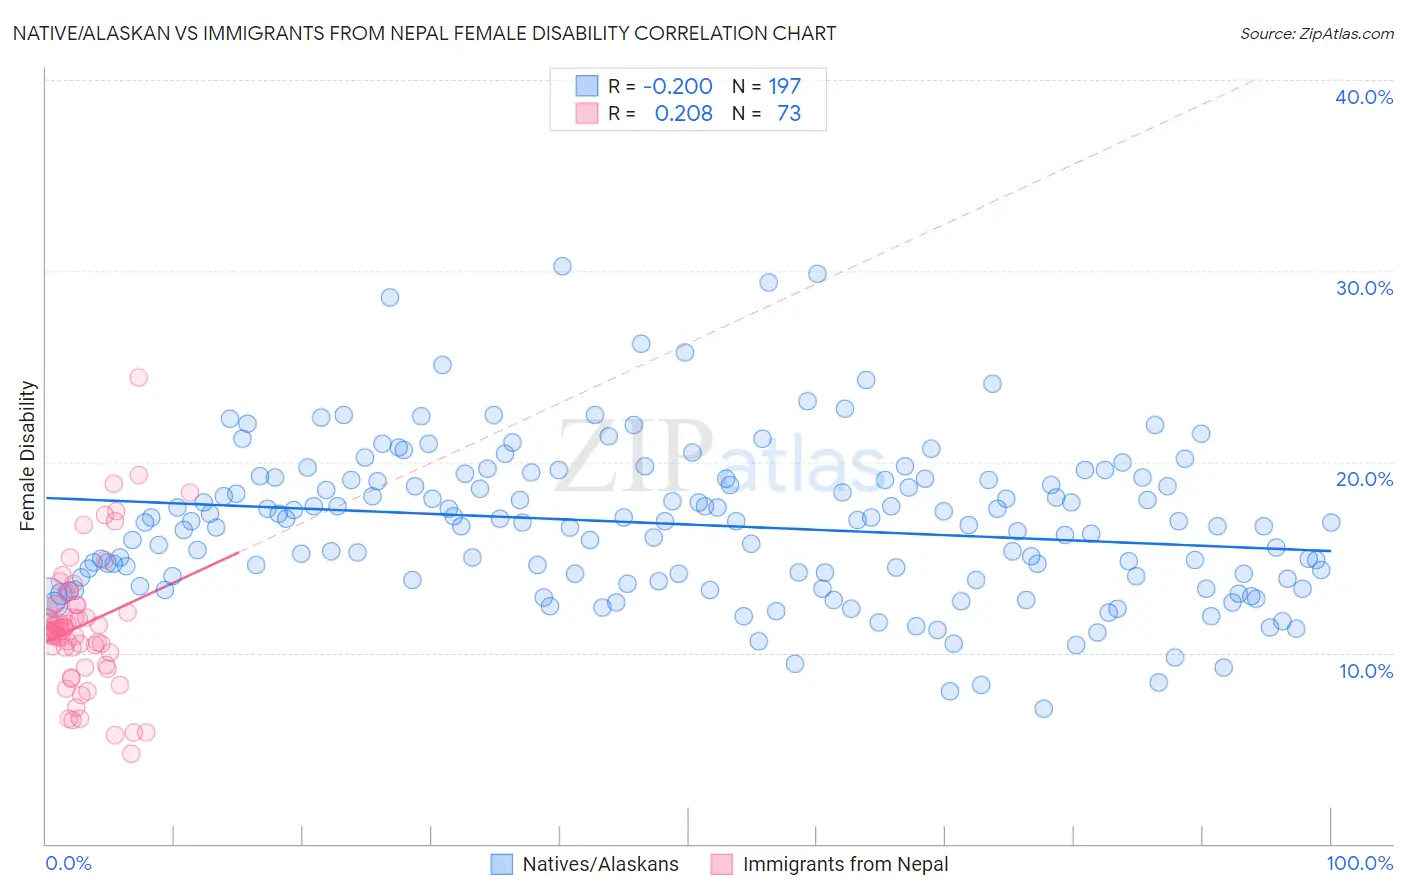
Native/Alaskan vs Immigrants from Nepal Female Disability Correlation Chart
The statistical analysis conducted on geographies consisting of 512,836,768 people shows a weak negative correlation between the proportion of Natives/Alaskans and percentage of females with a disability in the United States with a correlation coefficient (R) of -0.200 and weighted average of 14.1%. Similarly, the statistical analysis conducted on geographies consisting of 186,780,675 people shows a weak positive correlation between the proportion of Immigrants from Nepal and percentage of females with a disability in the United States with a correlation coefficient (R) of 0.208 and weighted average of 11.3%, a difference of 25.5%.
Female Disability Correlation Summary
| Measurement | Native/Alaskan | Immigrants from Nepal |
| Minimum | 7.0% | 4.7% |
| Maximum | 30.2% | 24.4% |
| Range | 23.2% | 19.7% |
| Mean | 16.7% | 11.4% |
| Median | 16.8% | 11.1% |
| Interquartile 25% (IQ1) | 13.9% | 10.1% |
| Interquartile 75% (IQ3) | 19.1% | 12.4% |
| Interquartile Range (IQR) | 5.2% | 2.2% |
| Standard Deviation (Sample) | 4.0% | 3.4% |
| Standard Deviation (Population) | 4.0% | 3.4% |
Similar Demographics by Female Disability
Demographics Similar to Natives/Alaskans by Female Disability
In terms of female disability, the demographic groups most similar to Natives/Alaskans are Black/African American (14.1%, a difference of 0.020%), Navajo (14.2%, a difference of 0.14%), Pueblo (14.1%, a difference of 0.18%), Potawatomi (14.1%, a difference of 0.20%), and Comanche (14.2%, a difference of 0.25%).
| Demographics | Rating | Rank | Female Disability |
| Chippewa | 0.0 /100 | #317 | Tragic 14.0% |
| Paiute | 0.0 /100 | #318 | Tragic 14.0% |
| Iroquois | 0.0 /100 | #319 | Tragic 14.0% |
| Americans | 0.0 /100 | #320 | Tragic 14.1% |
| Potawatomi | 0.0 /100 | #321 | Tragic 14.1% |
| Pueblo | 0.0 /100 | #322 | Tragic 14.1% |
| Blacks/African Americans | 0.0 /100 | #323 | Tragic 14.1% |
| Natives/Alaskans | 0.0 /100 | #324 | Tragic 14.1% |
| Navajo | 0.0 /100 | #325 | Tragic 14.2% |
| Comanche | 0.0 /100 | #326 | Tragic 14.2% |
| Ottawa | 0.0 /100 | #327 | Tragic 14.2% |
| Cape Verdeans | 0.0 /100 | #328 | Tragic 14.2% |
| Osage | 0.0 /100 | #329 | Tragic 14.3% |
| Yuman | 0.0 /100 | #330 | Tragic 14.5% |
| Immigrants | Cabo Verde | 0.0 /100 | #331 | Tragic 14.6% |
Demographics Similar to Immigrants from Nepal by Female Disability
In terms of female disability, the demographic groups most similar to Immigrants from Nepal are Jordanian (11.3%, a difference of 0.020%), Zimbabwean (11.3%, a difference of 0.020%), Tongan (11.3%, a difference of 0.030%), Immigrants from Sweden (11.3%, a difference of 0.050%), and Cambodian (11.3%, a difference of 0.080%).
| Demographics | Rating | Rank | Female Disability |
| Immigrants | Lithuania | 100.0 /100 | #39 | Exceptional 11.2% |
| Mongolians | 100.0 /100 | #40 | Exceptional 11.2% |
| Paraguayans | 100.0 /100 | #41 | Exceptional 11.2% |
| Israelis | 100.0 /100 | #42 | Exceptional 11.2% |
| Afghans | 100.0 /100 | #43 | Exceptional 11.2% |
| Cambodians | 100.0 /100 | #44 | Exceptional 11.3% |
| Immigrants | Sweden | 100.0 /100 | #45 | Exceptional 11.3% |
| Immigrants | Nepal | 100.0 /100 | #46 | Exceptional 11.3% |
| Jordanians | 100.0 /100 | #47 | Exceptional 11.3% |
| Zimbabweans | 100.0 /100 | #48 | Exceptional 11.3% |
| Tongans | 100.0 /100 | #49 | Exceptional 11.3% |
| Inupiat | 100.0 /100 | #50 | Exceptional 11.3% |
| Immigrants | Belgium | 100.0 /100 | #51 | Exceptional 11.3% |
| Immigrants | Peru | 99.9 /100 | #52 | Exceptional 11.3% |
| Immigrants | Saudi Arabia | 99.9 /100 | #53 | Exceptional 11.3% |